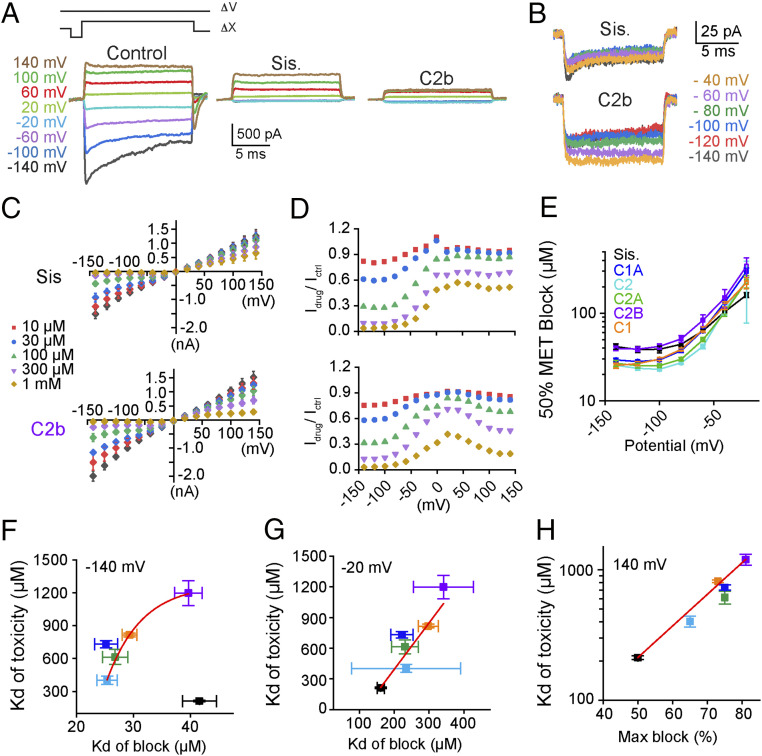
Fig. 4.
Components of hospital gentamicin bind and block the hair cell MET channel. (A, Upper) The timing of the voltage steps (∆V) and mechanical stimulus (∆X) used to evoke maximal MET currents. (Lower) Control currents are showed in (Left) with responses in the presence of sisomicin or gentamicin C2b presented Center and Right, respectively. The currents shown are net mechanosensitive currents where color indicates voltage step. (B) Negative potential responses in the presence of sisomicin (Upper) and gentamicin C2b (Lower, both 1 mM). (C) Summary voltage (mV)–current (nA) plots for sisomicin and gentamicin 2b, where color denotes drug concentration as indicated. Data from C were used to identify half-blocking drug concentrations used for plots in E–G. Data from C were also used to generate plots of drug block of MET channel normalized at each voltage (D). (D) Data were derived from the corresponding plot in (C and SI Appendix, Fig. S5A) for each drug. (E) Plots showing membrane potential against the half blocking dose, derived from the data in C and SI Appendix, Fig. S5A, of each tested aminoglycoside as indicated by the color code. (F) Plots showing the half-blocking concentration obtained at −140 mV against the Kd for ototoxicity obtained in Fig. 3. (G) Plots showing half-blocking dose at −20 mV against the ototoxicity Kd. (H) The maximal block at +140 mV against the ototoxicity Kd at 1 mM. n = 8 for each drug.

