Fig. 5.
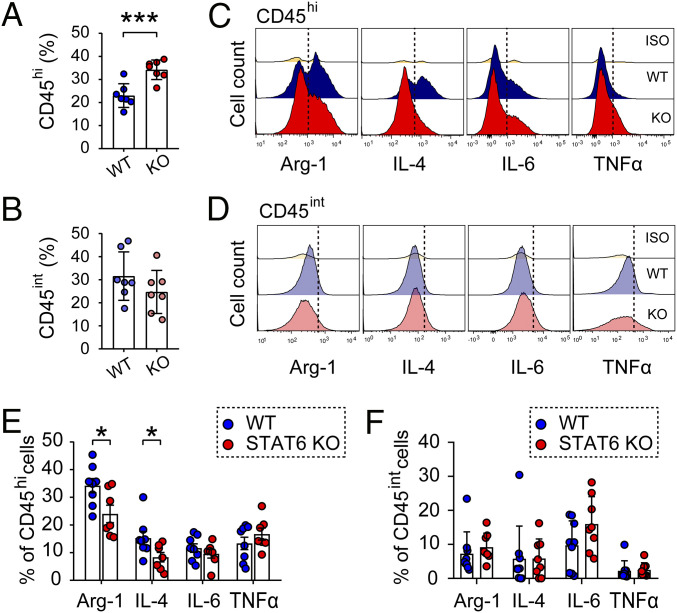
STAT6 tempers neuroinflammatory reactions in microglia and macrophages after ICH. ICH was induced in WT and STAT6 KO mice by blood injection into the right striatum, and mice were killed 5 d after ICH. (A and B) Quantification of CD45hiCD11b+ macrophages/activated microglia (A) and CD45intCD11b+ resting microglia (B) as percentages per total number of single cells in each brain. (C and D) Flow cytometry was used to assess the expression of phenotypic markers by microglia/macrophages in the ICH brain. Representative flow cytometry plots showing the expression of Arg1, IL-4, IL-6, and TNF-α expression in CD45hiCD11b+ macrophages/activated microglia (C) and in CD45intCD11b+ resting microglia (D). (E and F) The expression of neuroinflammation associated markers were expressed as percentages of specific marker positive cells per total number of CD45hiCD11b+ macrophages/activated microglia (E) or CD45intCD11b+ resting microglia (F). Iso: Rabbit IgG as an isotype control. Dashed lines show the gating for positive cell populations based on the position of fluorescence minus one controls. n = 7 to 9 per group. *P < 0.05, ***P < 0.001 STAT6 KO vs. WT by Student’s t test (A, B, and E) or by Mann–Whitney U test (F).

