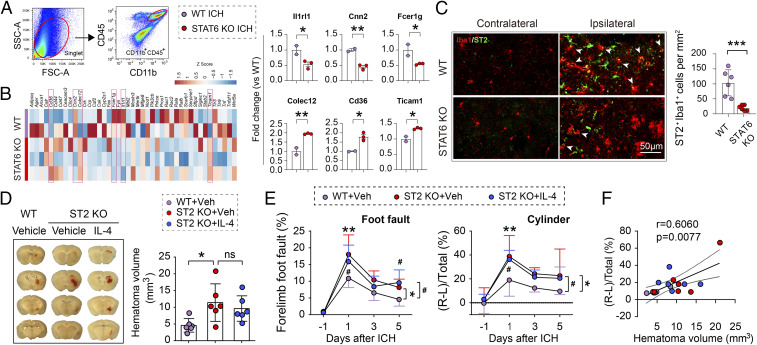
Fig. 8.
ST2 as a signaling molecule downstream of STAT6 in facilitating hematoma resolution after ICH. ICH was induced in WT and STAT6 KO mice by blood injections into the right striatum. CD45hiCD11b+ microglia/macrophages were sorted from the ipsilateral brain 5 d after ICH. PCR arrays were used to analyze the differential expression of genes related to phagocytosis. (A) Representative plots illustrate the gating strategy for the FACS sorting of CD45+CD11b+ cells from ischemic brain. (B, Left) Heatmap showing PCR array expression profiles of 45 detected genes involved in phagocytosis regulation. n = 2 to 3 biological replicates per group, each sample pooled from 3 mice. (Right) Genes differentially expressed between STAT6 KO and WT mice after ICH (P < 0.05 by t test, indicated by red boxes in heatmap) are further presented in the form of mean ± SD (C, Left) Representative images of immunofluorescent staining of ST2 expression on Iba1+ macrophages/activated microglia. (Right) Quantification of Iba1+ST2+ cells in the perihematoma regions 5 d after ICH. (D) ICH was induced in WT and ST2 KO mice by blood injection into the right striatum. IL-4 nanoparticles were applied intranasally starting 2 h after ICH and repeated daily for 4 d. (Left) Representative coronal brain sections show the intracerebral hematoma 5 d after ICH. (Right) Quantification of hematoma volumes on brain sections. n = 6 per group. Note that hematoma volumes were significantly larger in ST2 KO mice compared to WT mice, whereas IL-4 treatment failed to reduce hematoma volumes in ST2 KO mice. (E) Sensorimotor functions were assessed by foot fault (Left) and cylinder (Right) tests before ICH (−1 d) and 1, 3, and 5 d after ICH. n = 6 per group. (F) Spearman correlation analysis between the cylinder test and hematoma volumes 5 d after ICH. *P < 0.05, **P < 0.01, ***P < 0.001 ST2 KO vehicle vs. WT vehicle or as indicated, #P < 0.05 ST2 KO+IL4 vs. WT vehicle by Student’s t test (B and C), one-way ANOVA (D), or two-way repeated measures ANOVA (E) and Bonferroni post hoc tests. ns, not significant. The asterisks at the right indicate the group differences. The asterisks on the top indicate single day comparison between the two groups.

