Fig. 2.
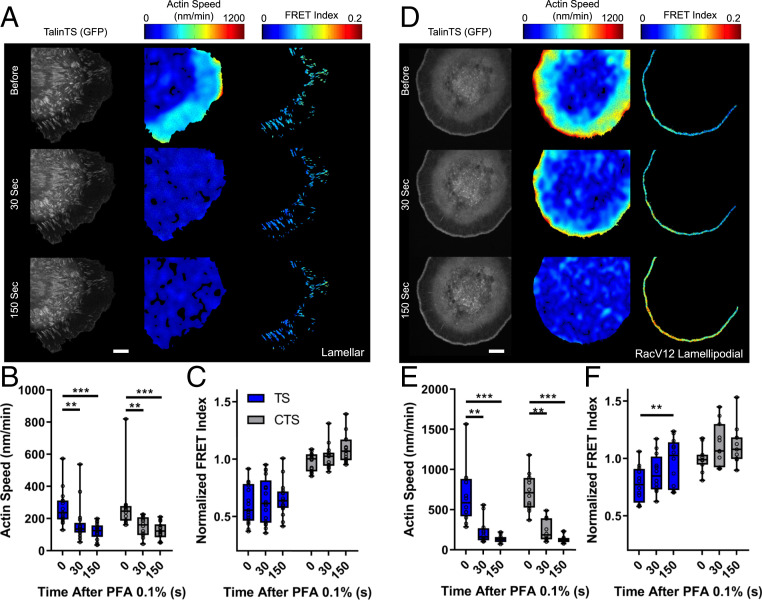
Evaluating flow dependence. (A) Control cells before and after stopping flow with 0.1% PFA for lamellar adhesions, showing talinTS, actin speed, and talin normalized FRET index. (B) Quantification of actin flow speed before and after addition of 0.1% PFA. (C) Quantified per-cell average talin TS and CTS normalized FRET index in lamellar adhesions normalized to the control sensor. Values for actin flow speed were averaged over 1-min intervals before, 0 to 60 s after (30 s) or 120 to 180 s (150 s) after addition of 0.1% PFA (box plots indicate median and quartiles, dots indicate single-cell averages, n = 14 to 17 cells per group from five independent experiments, #P < 0.05, two-way ANOVA with Tukey’s post hoc test). (D) Representative images of talinTS, actin speed, and talin TS normalized FRET index in RacV12 cells. (E) Average actin flow rates and (F) talin normalized FRET index for RacV12 lamellipodial adhesions (box plots indicate median and quartiles, dots indicate single-cell averages, n = 11 or 12 cells per group from three independent experiments, **P < 0.01, ***P < 0.001, two-way ANOVA with Tukey’s post hoc test). (Scale bars, 10 µm.)

