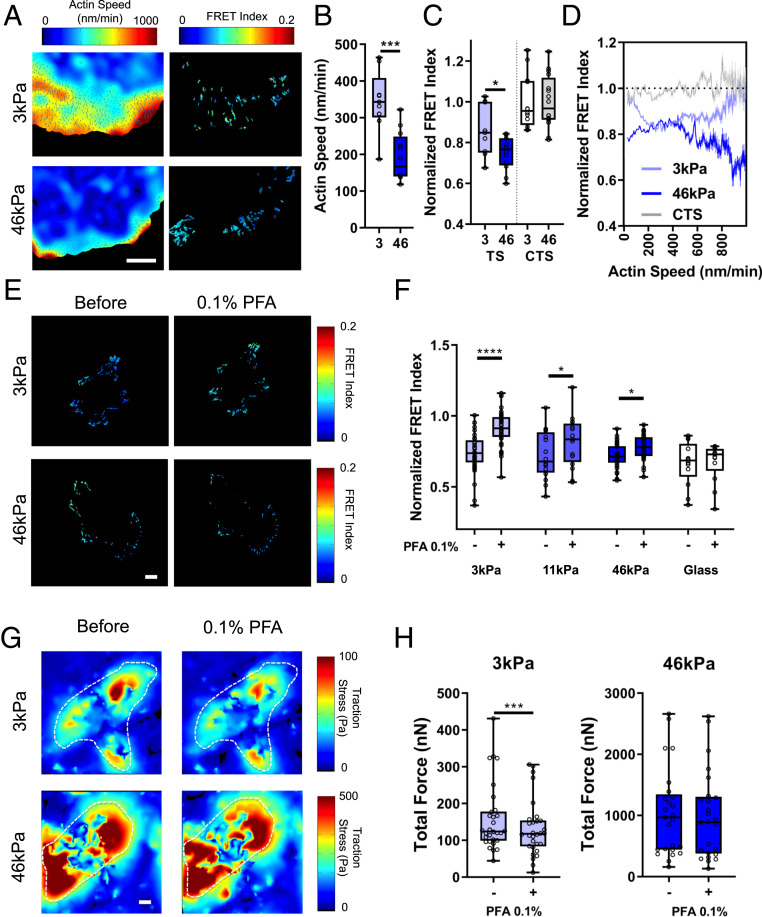
Fig. 3.
Modulation by substrate stiffness. (A) Heat maps of actin speed (Left) and talin TS normalized FRET index (Right) in cells on soft (3-kPa) or stiff (46-kPa) fibronectin-coated polyacrylamide gels. (Scale bar, 10 µm.) (B) Average per cell actin speed and (C) normalized FRET index (box plots indicate median and quartiles, dots indicate single-cell averages, n = 9 to 16 cells from two independent experiments, *P < 0.01, ***P < 0.001). (D) Binned pixelwise correlations of FRET vs. actin speed (mean ± 95% confidence interval, 3 kPa n = 9, 46 kPa n = 12, CTS 3 kPa n = 9). (E) Heat maps of talin TS normalized FRET index before and after 0.1% PFA for cells on polyacrylamide gels. (Scale bar, 10 µm.) (F) Average talin TS FRET index per cell (normalized to CTS control on same stiffness) before and after 0.1% PFA (box plots indicate median and quartiles, dots indicate single-cell averages, 3 kPa n = 37, 11 kPa n = 16, 46 kPa n = 33, glass n = 13, matched cells per group from five independent experiments. *P < 0.05, ****P < 0.0001, two-way ANOVA with Sidak’s post hoc test). (G) Traction force heat maps for cells on 3-kPa or 46-kPa polyacrylamide gels before and after 0.1% PFA. (Scale bar, 10 µm.) (H) Quantification of total force per cell before (−) and after (+) 0.1% PFA on 3-kPa and 46-kPa gels (box plots indicate median and quartiles, dots indicate single cell averages, 3 kPa n = 30, 46 kPa n = 25, matched cells per group from three independent experiments, ***P < 0.001, two-sided paired t test).

