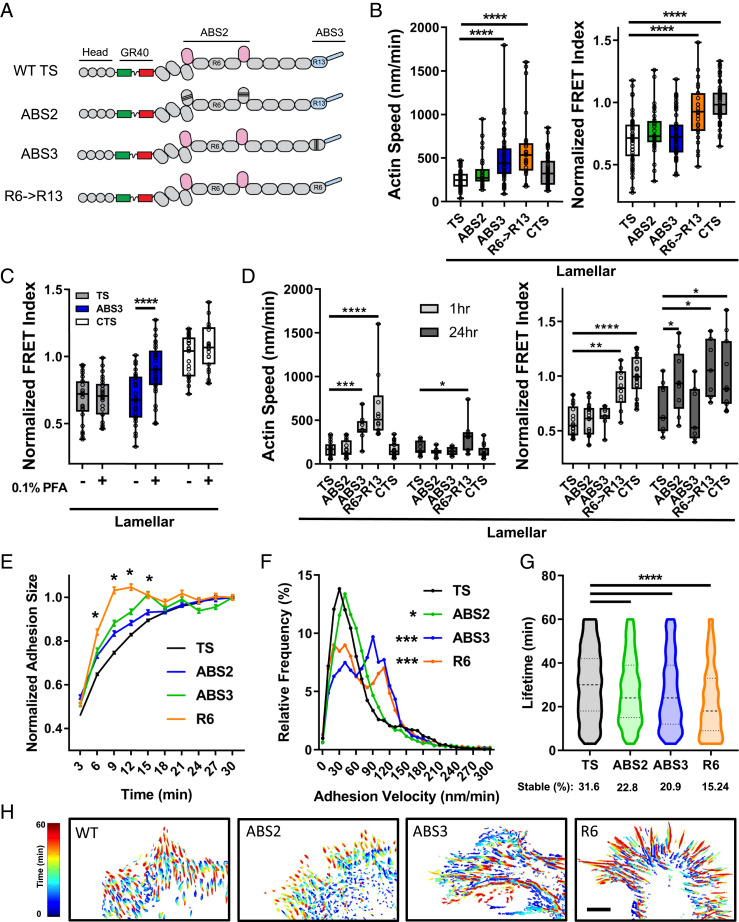
Fig. 6.
Actin binding site mutations in talin. (A) Schematic of the ABS2 (six point mutations), ABS3 (three point mutations), and R6->R13 swap constructs in the talin tension sensor. (B) Average per-cell actin speed and normalized FRET index for lamellar adhesions in cells with talin mutants (box plots indicate median and quartiles, dots indicate single cell averages, n = 25 t 31 cells per group from three independent experiments, ****P < 0.0001, one-way ANOVA with Tukey’s post hoc test). (C) Talin normalized FRET index in lamellar adhesions of cells with WT or ABS3 mutant talin before (−) and after (+) 0.1% PFA (box plots indicate median and quartiles, dots indicate single-cell averages, TS: n = 25, ABS3 n = 28, CTS n = 23, matched cells from five independent experiments, ****P < 0.0001). (D) Actin speed and talin normalized FRET index for lamellar adhesions in cells at 1 vs. 24 h (box plots indicate median and quartiles, dots indicate single-cell averages, n = 7 to 22 cells per group, *P < 0.05, **P < 0.01, ***P < 0.001, ****P < 0.0001, two-way ANOVA with Sidak’s post hoc test). Adhesion dynamics in talin-depleted cells reconstituted with WT (TS) or mutant (ABS2, ABS3, R6) talinTS. (E) Average adhesion size normalized to their maximal size (mean ± SEM, WT n = 20,732 adhesions from 49 cells, ABS2 n = 6,643 adhesions from 18 cells, ABS3 n = 3,571 adhesions from 18 cells, R6 n = 3,895 adhesions from 18 cells, *P < 0.01 vs. TS). (F) Adhesion velocity and adhesion lifetime (G) distributions for talin actin binding site mutants (violin plot with median and quartiles, cells imaged for 1 h at one frame per 3 min. *P < 0.05, ***P < 0.001, one-way ANOVA with Dunnett’s post hoc test). (H) Representative heat maps of adhesion dynamics over 1 h. (Scale bar, 10 µm.)

