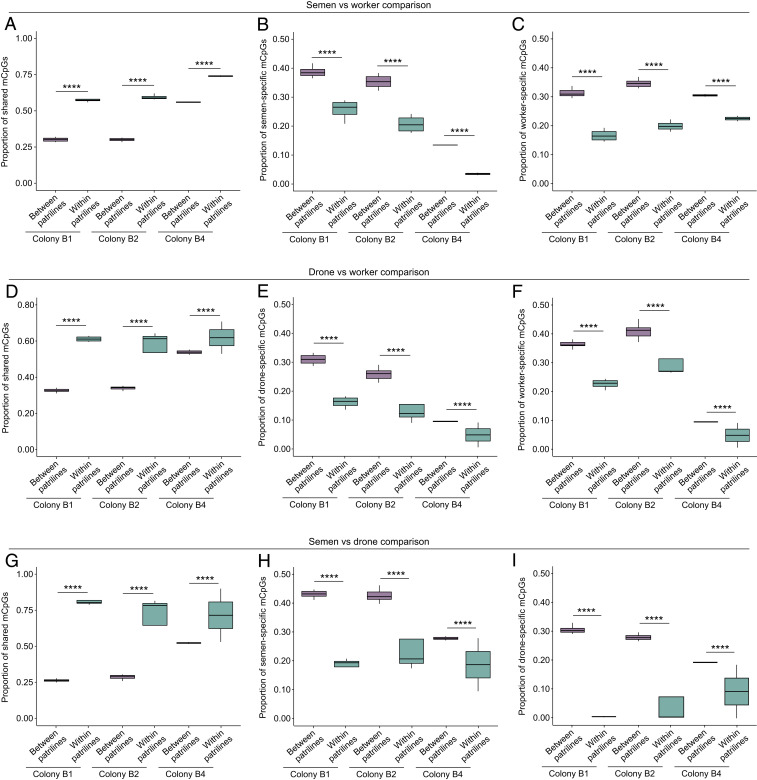
Fig. 4.
Overlap of mCpGs within and between patrilines in colonies B1, B2, and B4. (A–C) Semen vs. worker comparison showing the proportion of (A) shared mCpGs, (B) semen-specific mCpGs, and (C) worker-specific mCpGs. (D–F) Drone vs. worker comparison showing the proportion of (D) shared mCpGs, (E) drone-specific mCpGs, and (F) worker-specific mCpGs. (G–I) Semen vs. drone comparison showing the proportion of (G) shared mCpGs, (H) semen-specific mCpGs, and (I) drone-specific mCpGs. Box plots represent median, IQR, and 1.5 × IQR. GLMMs: ****P < 0.0001.

