Fig. 1.
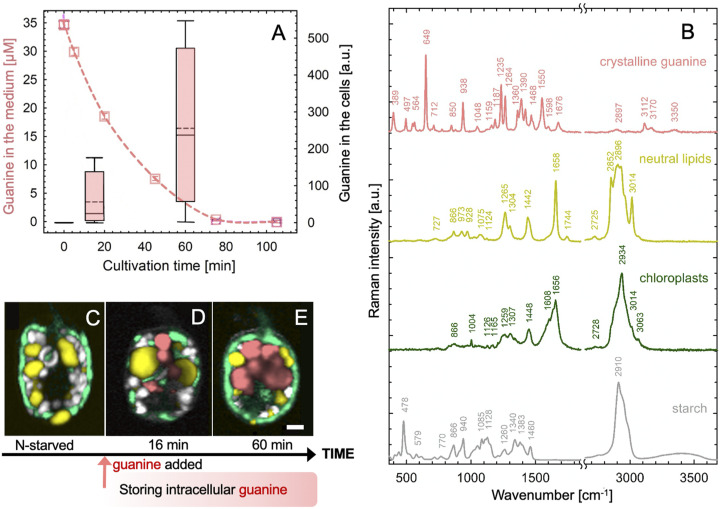
Rapid uptake of guanine by N-starved A. carterae led to the accumulation of intracellular guanine inclusions. Cells were suspended in a saturated solution of guanine (∼35 μM at 20 °C) in N-deficient f/2 medium at a density of 1.7 ± 0.3 × 10⁵ cells·mL−1. The dashed line in A shows the declining concentration of guanine in the medium as measured by ultraviolet absorption (SI Appendix, section II.1.B). The simultaneous accumulation of guanine in the cells was assessed using Raman microscopy (SI Appendix, section II.1.C) and is shown in the boxplot. Raman spectra in B were used to generate the Raman maps in C–E that represent: (C) a typical cell after 2 wk without a N source and (D and E) cells during progressive guanine accumulation. Color legend: guanine (pink), lipids (yellow), chloroplast (green), and starch (white/gray). (Scale bar, 2 μm.) Raman maps showing separate cellular constituents in C–E are constructed as described in SI Appendix, section I.1 and presented in SI Appendix, Fig. S1.

