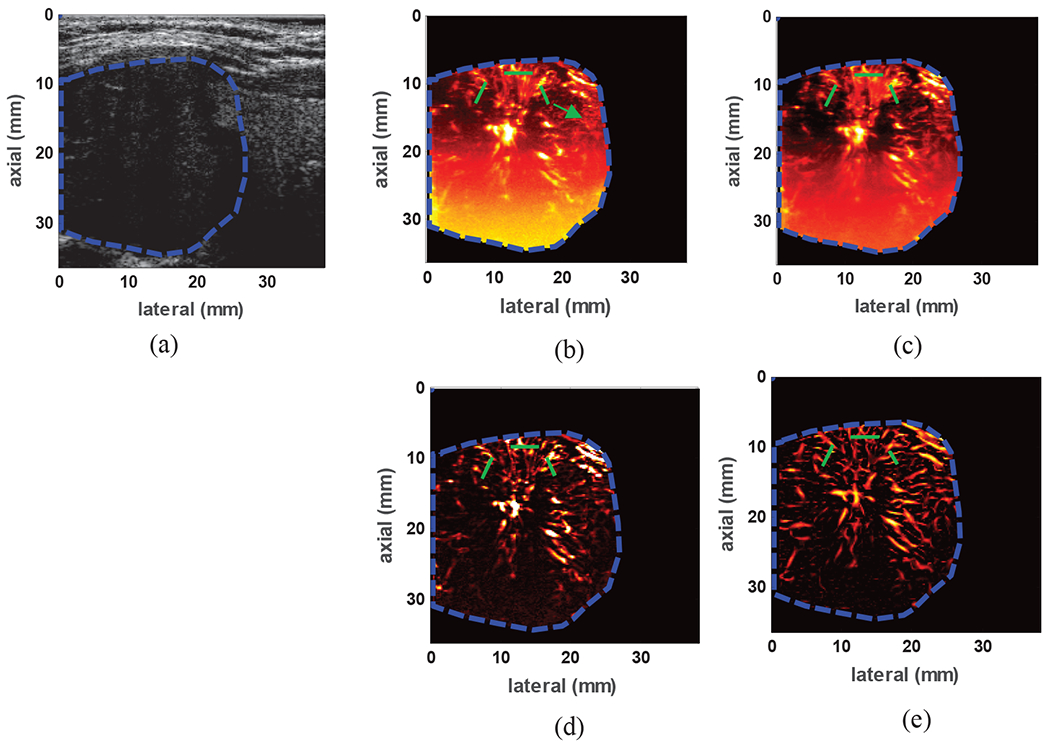
Fig. 8:

(a) B-mode image of a malignant papillary carcinoma identified between two vertical black columns (b) power Doppler image using conventional IIR filtering (green arrow indicates residual clutter signal) with 75Hz cutoff frequency (c) gross vasculature image in the nodule using SVT, (d) vasculature image after SVT+THF (e) final image of the vasculature network inside the nodule after SVT+THF+VEF. The overlaid green lines indicate cross-sections from which PSL values were calculated.
