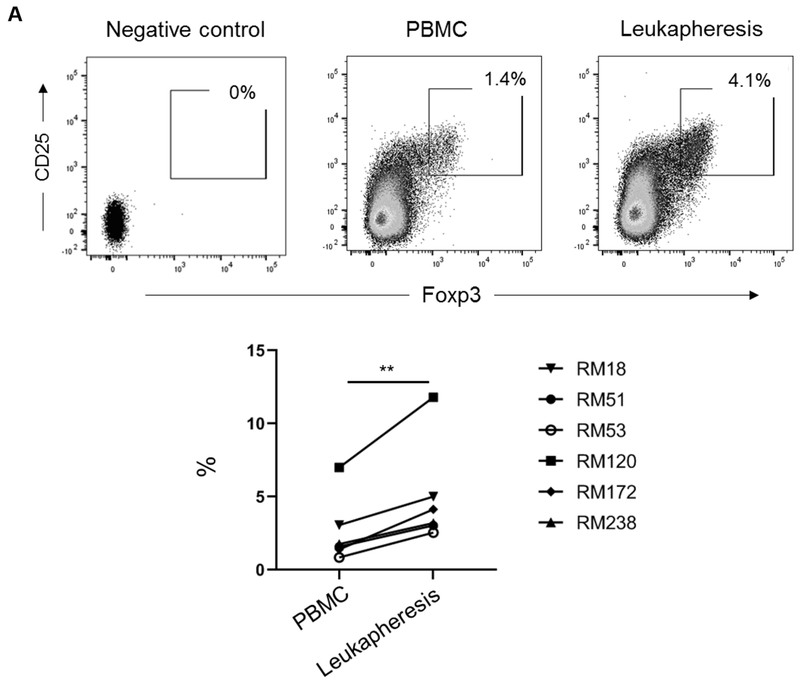
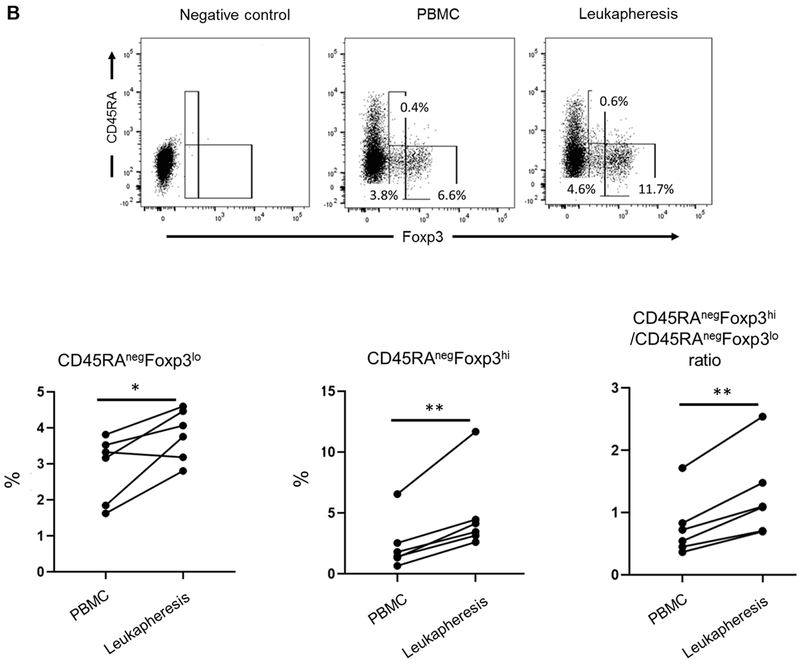
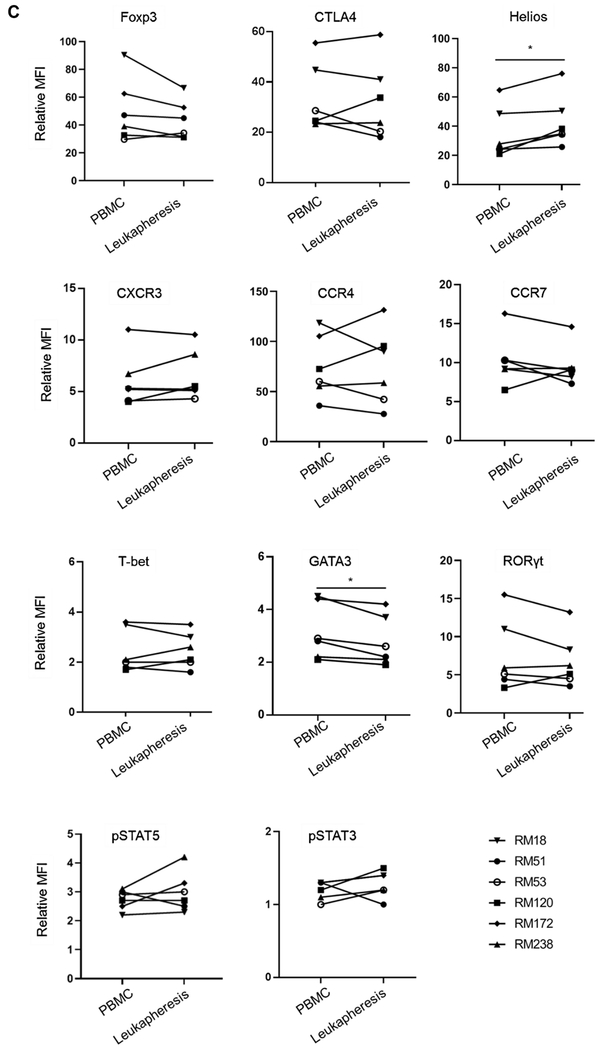
FIGURE 3. Incidence and phenotype of CD4+CD25hiFoxp3hi Treg in peripheral blood before and in leukapheresis products after GM-CSF/G-CSF administration.
(A) Percentages of CD4+CD25hiFoxp3hi Treg in PBMC and leukapheresis products were determined by flow cytometry. Dot plots represent data from one animal (upper panel) representative of six animals. The percentage of CD4+CD25hiFoxp3hi Treg in all six animals are shown in the lower panel. (B) Percentages of CD4+CD45RAnegFoxp3lo cells and CD4+CD45RAnegFoxp3hi cells (upper panel), and the ratios of CD4+CD45RAnegFoxp3hi / CD4+CD45RAnegFoxp3lo cells in all six animals (lower panel) are shown. Top left dot plots indicate isotype (negative) control. (C) Treg-associated markers (Foxp3, CTLA4 and Helios), chemokine receptors (CXCR3, CCR4 and CCR7), transcription factors (T-bet, GATA3 and RORγt) and pSTAT5 and pSTAT3 expression on Treg (n=6). * p<0.05, ** p<0.01. MFI = mean fluorescence intensity (Actual MFI values are shown in supplemental figure 4).


