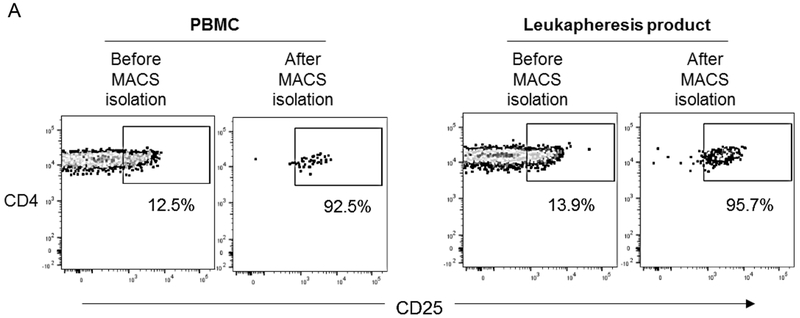
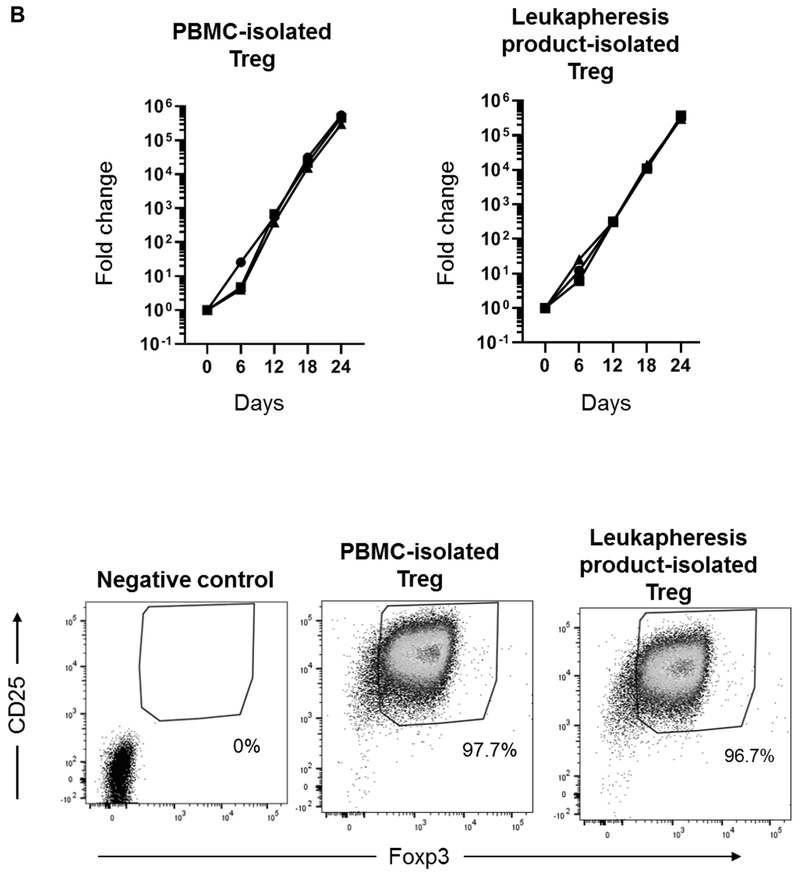
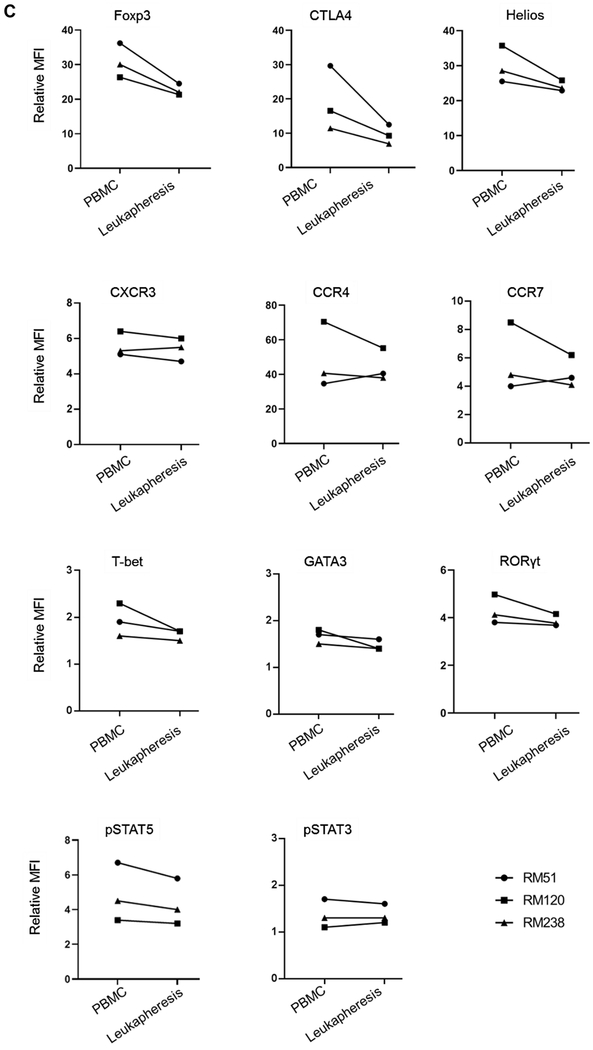
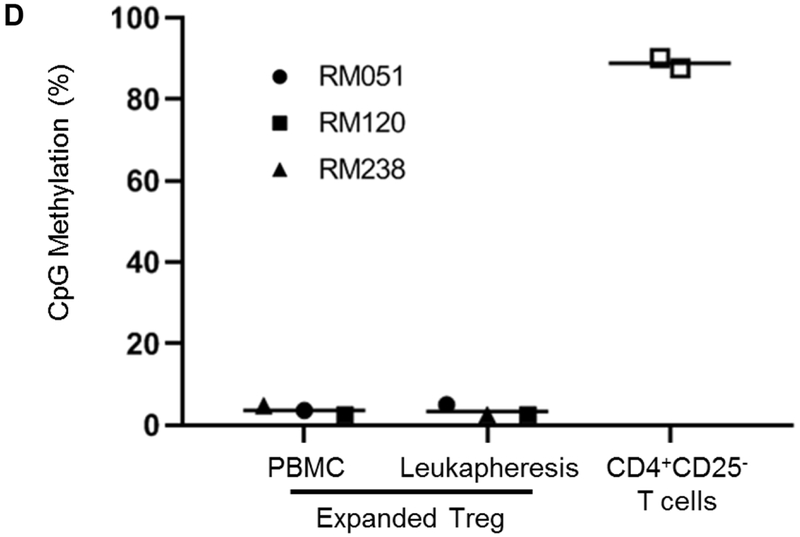
FIGURE 4. Isolation, expansion and phenotype of Treg isolated from PBMC before and in leukapheresis products after GM-CSF/G-CSF administration.
(A) Following MACS isolation, the purity of isolated Treg was evaluated. The percentages of CD4+CD25hi Treg (in PBMC and leukapheresis products) were evaluated before and after MACS isolation. Dot plots are from one animal representative of three animals. (B) Isolated Treg were expanded ex vivo for 24 days in co-culture with L-cells (upper panels), and the fold-increase determined (n=3). Percentages of CD4+CD25hiFoxp3hi expanded Treg were evaluated at 24 days by flow cytometry. Left dot plot indicates isotype (negative) control (C) Expanded Treg were evaluated for expression of Treg-associated markers (Foxp3, CTLA4 and Helios), chemokine receptors (CXCR3, CCR4 and CCR7), transcription factors (T-bet, GATA3 and RORγt) and pSTAT5 and pSTAT3 expression levels (n=3). MFI = mean fluorescence intensity. (D) The CpG methylation status of Foxp3 TSDR (Treg-specific demethylation region) in expanded Treg on day 24. (n=3). CD4+CD25− effector T cells were used as controls (n=2). The y axis shows methylation status of 8 CpG sites on average.


