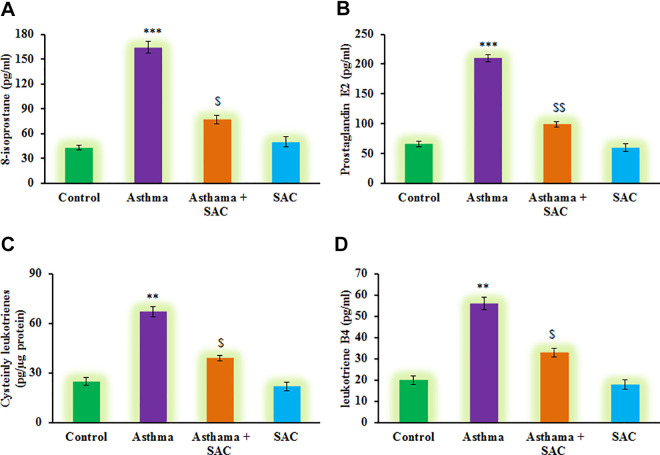
Figure 4.
(A-D) represents the analysis of inflammatory molecules such as 8-isoprostane, prostaglandin E2, cysteinyl leukotrienes and leukotriene B4 in the control and experimental group of rats. The experimental details were given in the methodology section. Values are expressed as mean ± S.E (n = 8). Statistical significance expressed as **p < 0.01, ***p < 0.001 compared to vehicle-treated controls, $p < 0.05, $$p < 0.01 SAC compared to asthma rats; ns denotes non-significant.

