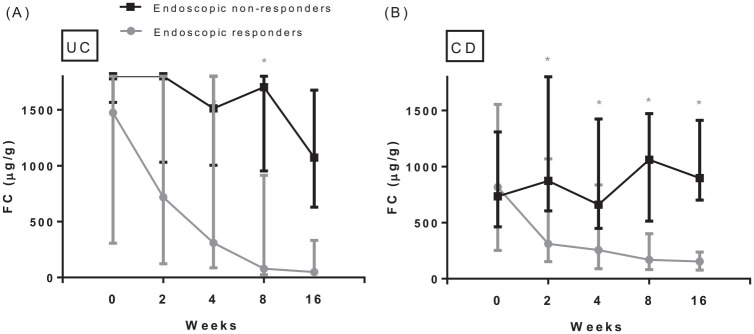
Figure 2.
Serial FC levels in UC (A) and CD (B) patients separately during vedolizumab induction, specified for patients with and without an endoscopic response.
Number of UC patients (FC) with/without endoscopic response at week 0: 13/5; week 2: 13/5; week 4: 12/4; week 8: 13/4; week 16: 11/4. Number of CD patients (FC) with/without endoscopic response at week 0: 13/13; week 2: 12/12; week 4: 13/12; week 8: 13/12; week 16: 13/12. Boxplots describe median and first and third quartile of FC at the predefined serial time points. FC values for UC patients with an endoscopic response: baseline: 1474 µg/g (Q1–Q3 306–1800); week 2: 718 µg/g (Q1–Q3 122–1800); week 4: 309 µg/g (Q1–Q3 86–1800); week 8: 78 µg/g (Q1–Q3 25–914); week 16: 49 µg/g (Q1–Q3 25–332). FC values for UC non-responders: baseline: 1800 µg/g (Q1–Q3 1566–1800); week 2: 1800 µg/g (Q1–Q3 1032–1800); week 4: 1513 µg/g (Q1–Q3 1004–1800); week 8: 1704 µg/g (Q1–Q3 954–1800); week 16: 1073 µg/g (Q1–Q3 630–1676). FC values for CD patients with an endoscopic response: baseline: 816 µg/g (Q1–Q3 252–1555); week 2: 310 µg/g (Q1–Q3 152–1068); week 4: 255 µg/g (Q1–Q3 89–835); week 8: 169 µg/g (Q1–Q3 82–401); week 16: 154 µg/g (Q1–Q3 77–238). FC values for CD non-responders: baseline: 734 µg/g (Q1–Q3 463–1309); week 2: 872 µg/g (Q1–Q3 605–1800); week 4: 661 µg/g (Q1–Q3 449–1424); week 8: 1062 µg/g (Q1–Q3 513–1472); week 16: 897 µg/g (Q1–Q3 701–1412).
*Indicates statistically different FC levels between patients with and without response as tested by the Wilcoxon Rank test.
CD, Crohn’s disease; FC, fecal calprotectin; Q, quartile; UC, ulcerative colitis.

