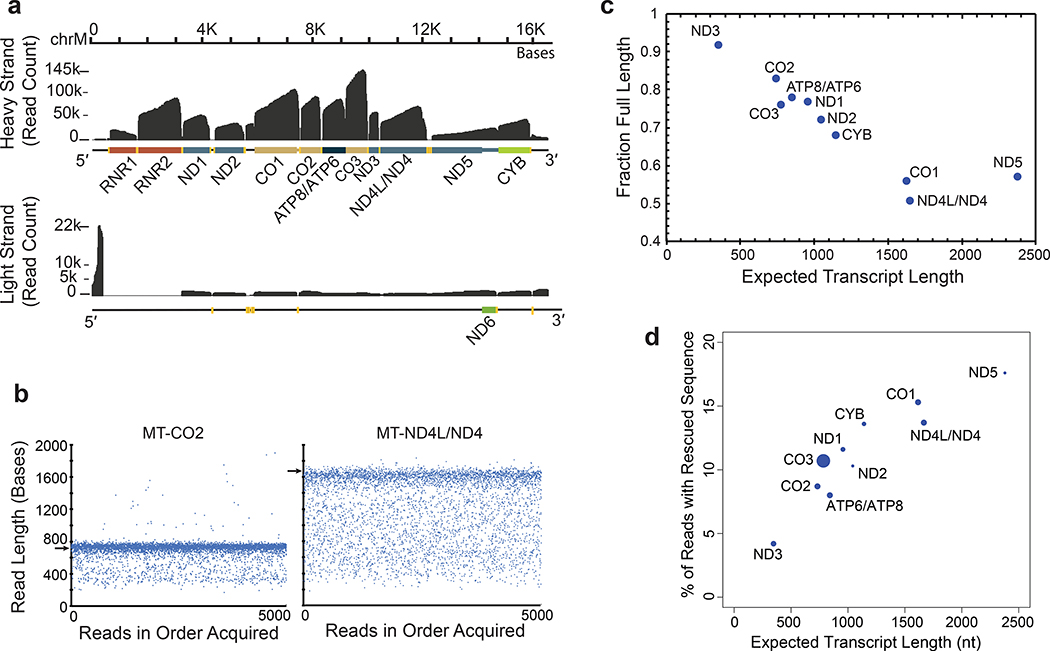
Figure 3.
Mitochondrially-encoded poly(A) RNA transcripts. (a) Read coverage of the H strand (top) and the L strand (bottom). Dark grey is base coverage along the MT genome. Labeled colored bars represent protein coding genes including known UTRs, or ribosomal RNA (RNR1, RNR2). Text denotes specific genes without the MT prefix. Yellow bars represent tRNA genes. (b) Distribution of nanopore read lengths for MT-CO2 and MT-ND4L/ND4 transcripts. Each point represents one of approximately 5000 reads in the order acquired from a single Lab 1 MinION experiment. Horizontal arrows are expected transcript read lengths. (c) Relationship between expected transcript read length and fraction of nanopore poly(A) RNA reads that were full length. Each point is for a protein coding transcript on the H strand. Labels are for mitochondrial genes without the MT prefix. See Online Methods for definition of ‘Full Length’. (d) Percent of artificially truncated strand reads where sequence was recovered from the ionic current signal. Points are for protein coding transcripts as in panel c.

