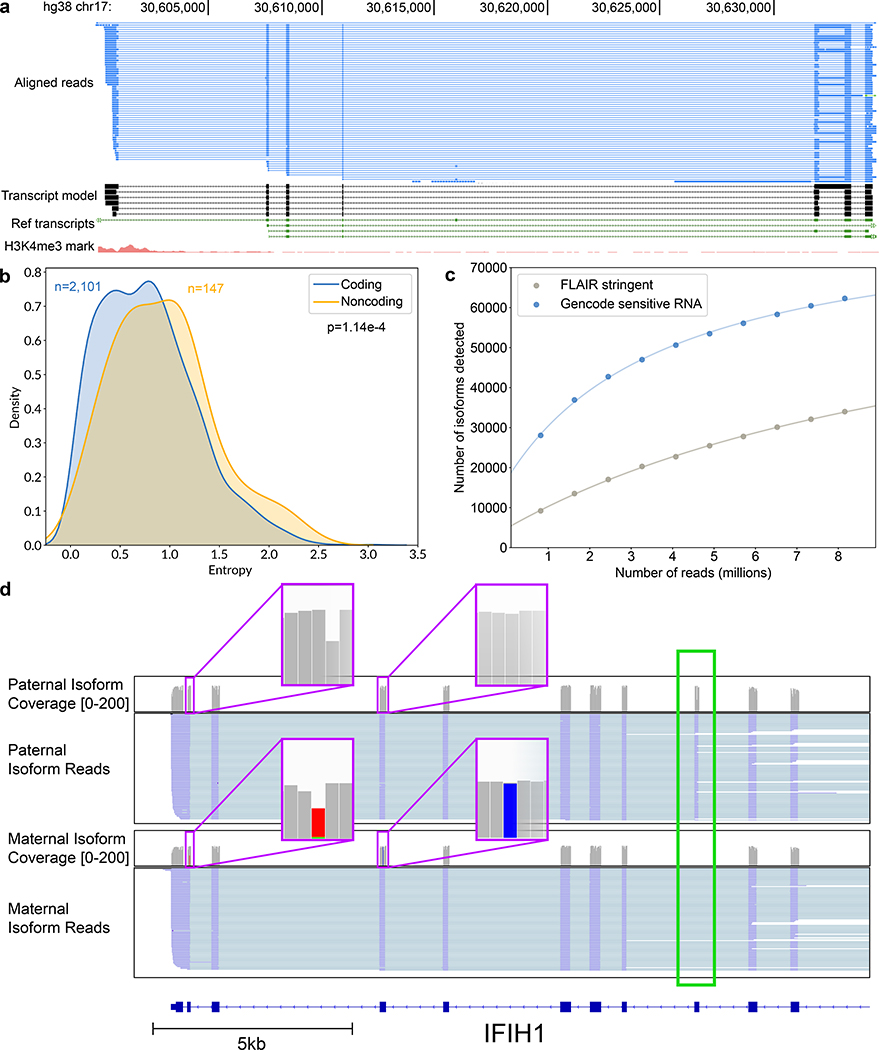
Figure 4.
Isoform-level analysis of GM12878 native poly(A) RNA sequence reads. (a) Genome browser view of unannotated isoforms that aligned to SMURF2P1-LRRC37BP1. The tracks are: a subset of the aligned native RNA reads (blue); the FLAIR-defined isoforms (black); SMURF2P1-LRRC37BP1 annotated isoforms from GENCODE v27 comprehensive set (green); transcription regulatory histone methylation marks (red). (b) Shannon entropy of isoform expression for coding versus noncoding genes detected by FLAIR. Only genes with at least 50 reads and more than two isoforms were used. The p-value was calculated from a Mann-Whitney U test. (c) Saturation plot showing the number of isoforms discovered (y-axis) versus the number of native RNA reads (x-axis). (d) IGV view of allele-specific isoforms for IFIH1. Purple boxes (insets) indicate the location of SNPs used to assign allele specificity (gray reference; red and blue SNPs). The alternatively spliced exon is indicated by a green box.

