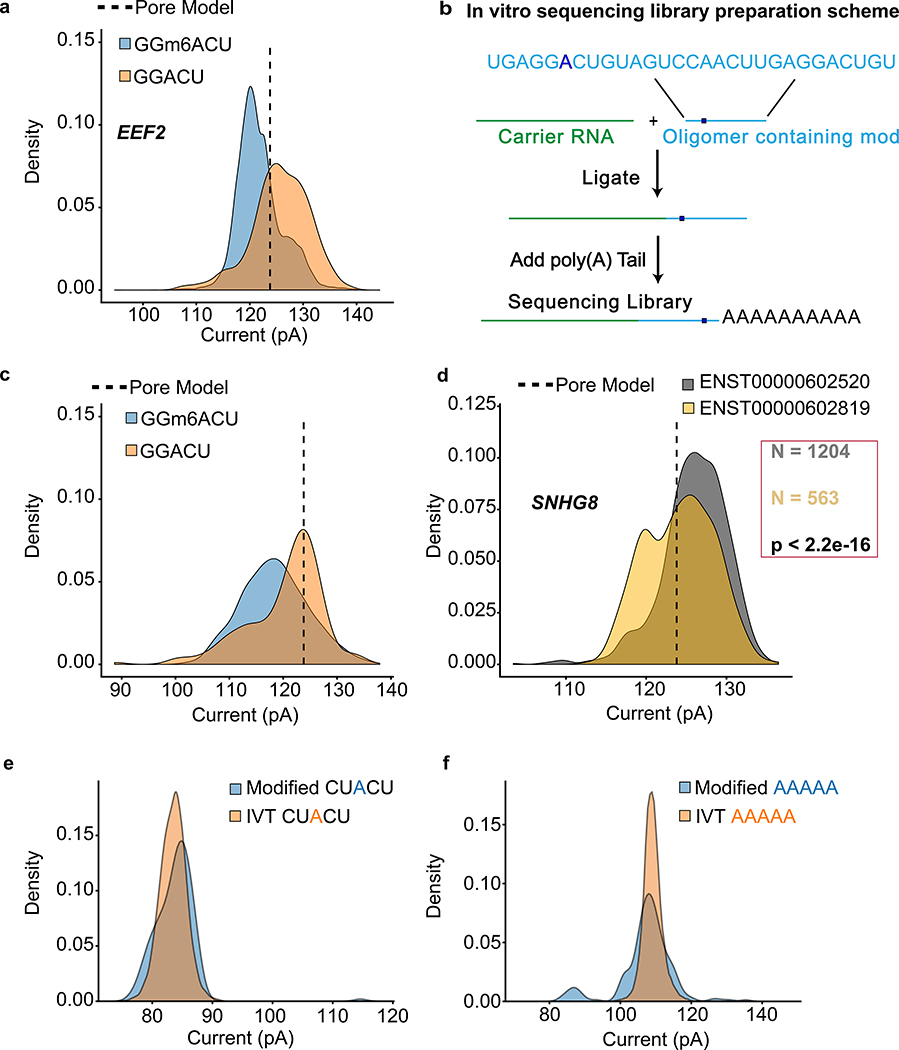
Figure 6.
Nanopore detection of m6A and inosine base modifications. (a) Comparing current signal from m6A-modified and unmodified GGACU motifs in the native RNA dataset for EEF2 and in vitro transcribed dataset. Pore model (indicated by a dashed line) is defined as the mean current amplitude (pA) for the canonical GGACU 5-mer in the ONT model. (b) Schematic for the oligomer-ligation. A synthetic RNA oligomer (Trilink Biotechnologies) containing canonical and modified m6A bearing GGACU 5-mer was ligated to a carrier RNA. This was followed by in vitro polyadenylation. (c) Comparison of ionic current signals for m6A-modified and canonical GGACU motifs. The data were acquired using the assay described in (b). (d) Ionic current distributions for GGACU motifs within SNHG8 gene isoforms (see gene models in Supplemental Figure 7). (e) Ionic current distributions for putative inosine-bearing CUACU 5-mer in the 3′-UTR region of the AHR gene. Blue is native RNA and orange is IVT RNA. (f) Ionic current distributions for putative inosine-bearing AAAAA 5-mer in the 3′-UTR region of the AHR gene. Blue is native RNA and orange is IVT RNA.

