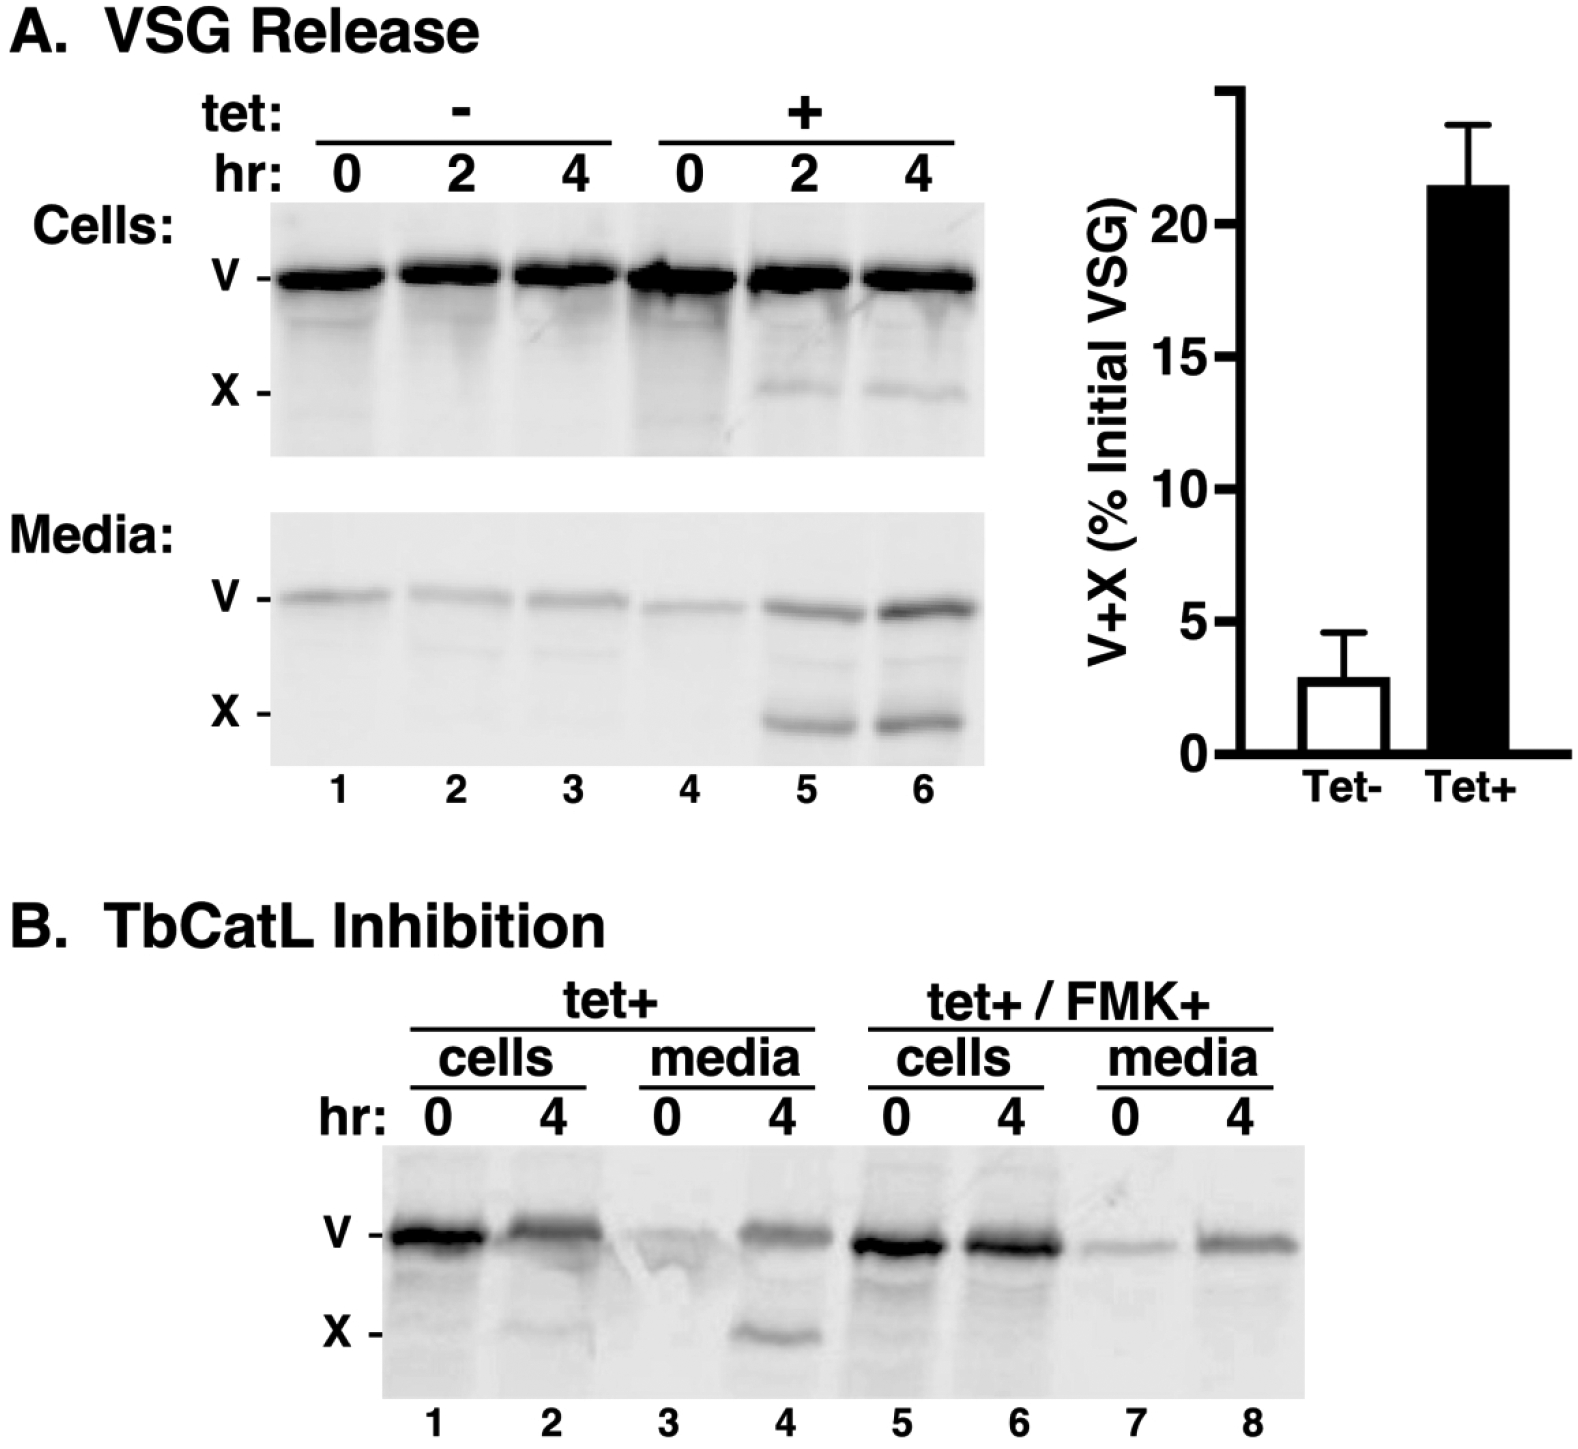
Figure 4. Release of VSG. A.

TbVps24 silencing was induced (12 hr) and VSG release was monitored by pulse chase radiolabeling and immunoprecipitation from cell (top left) and media (bottom left) fractions. Both panels are from the same gel/image and were processed identically prior to digital separation for presentation. Full length (V) and proteolytic (X) species are indicated. Released VSG (V+X) was quantified (mean ± std. dev., n=3). B. VSG release was assayed as above in the absence or presence of 20 μM FMK024 to block endogenous TbCatL activity.
