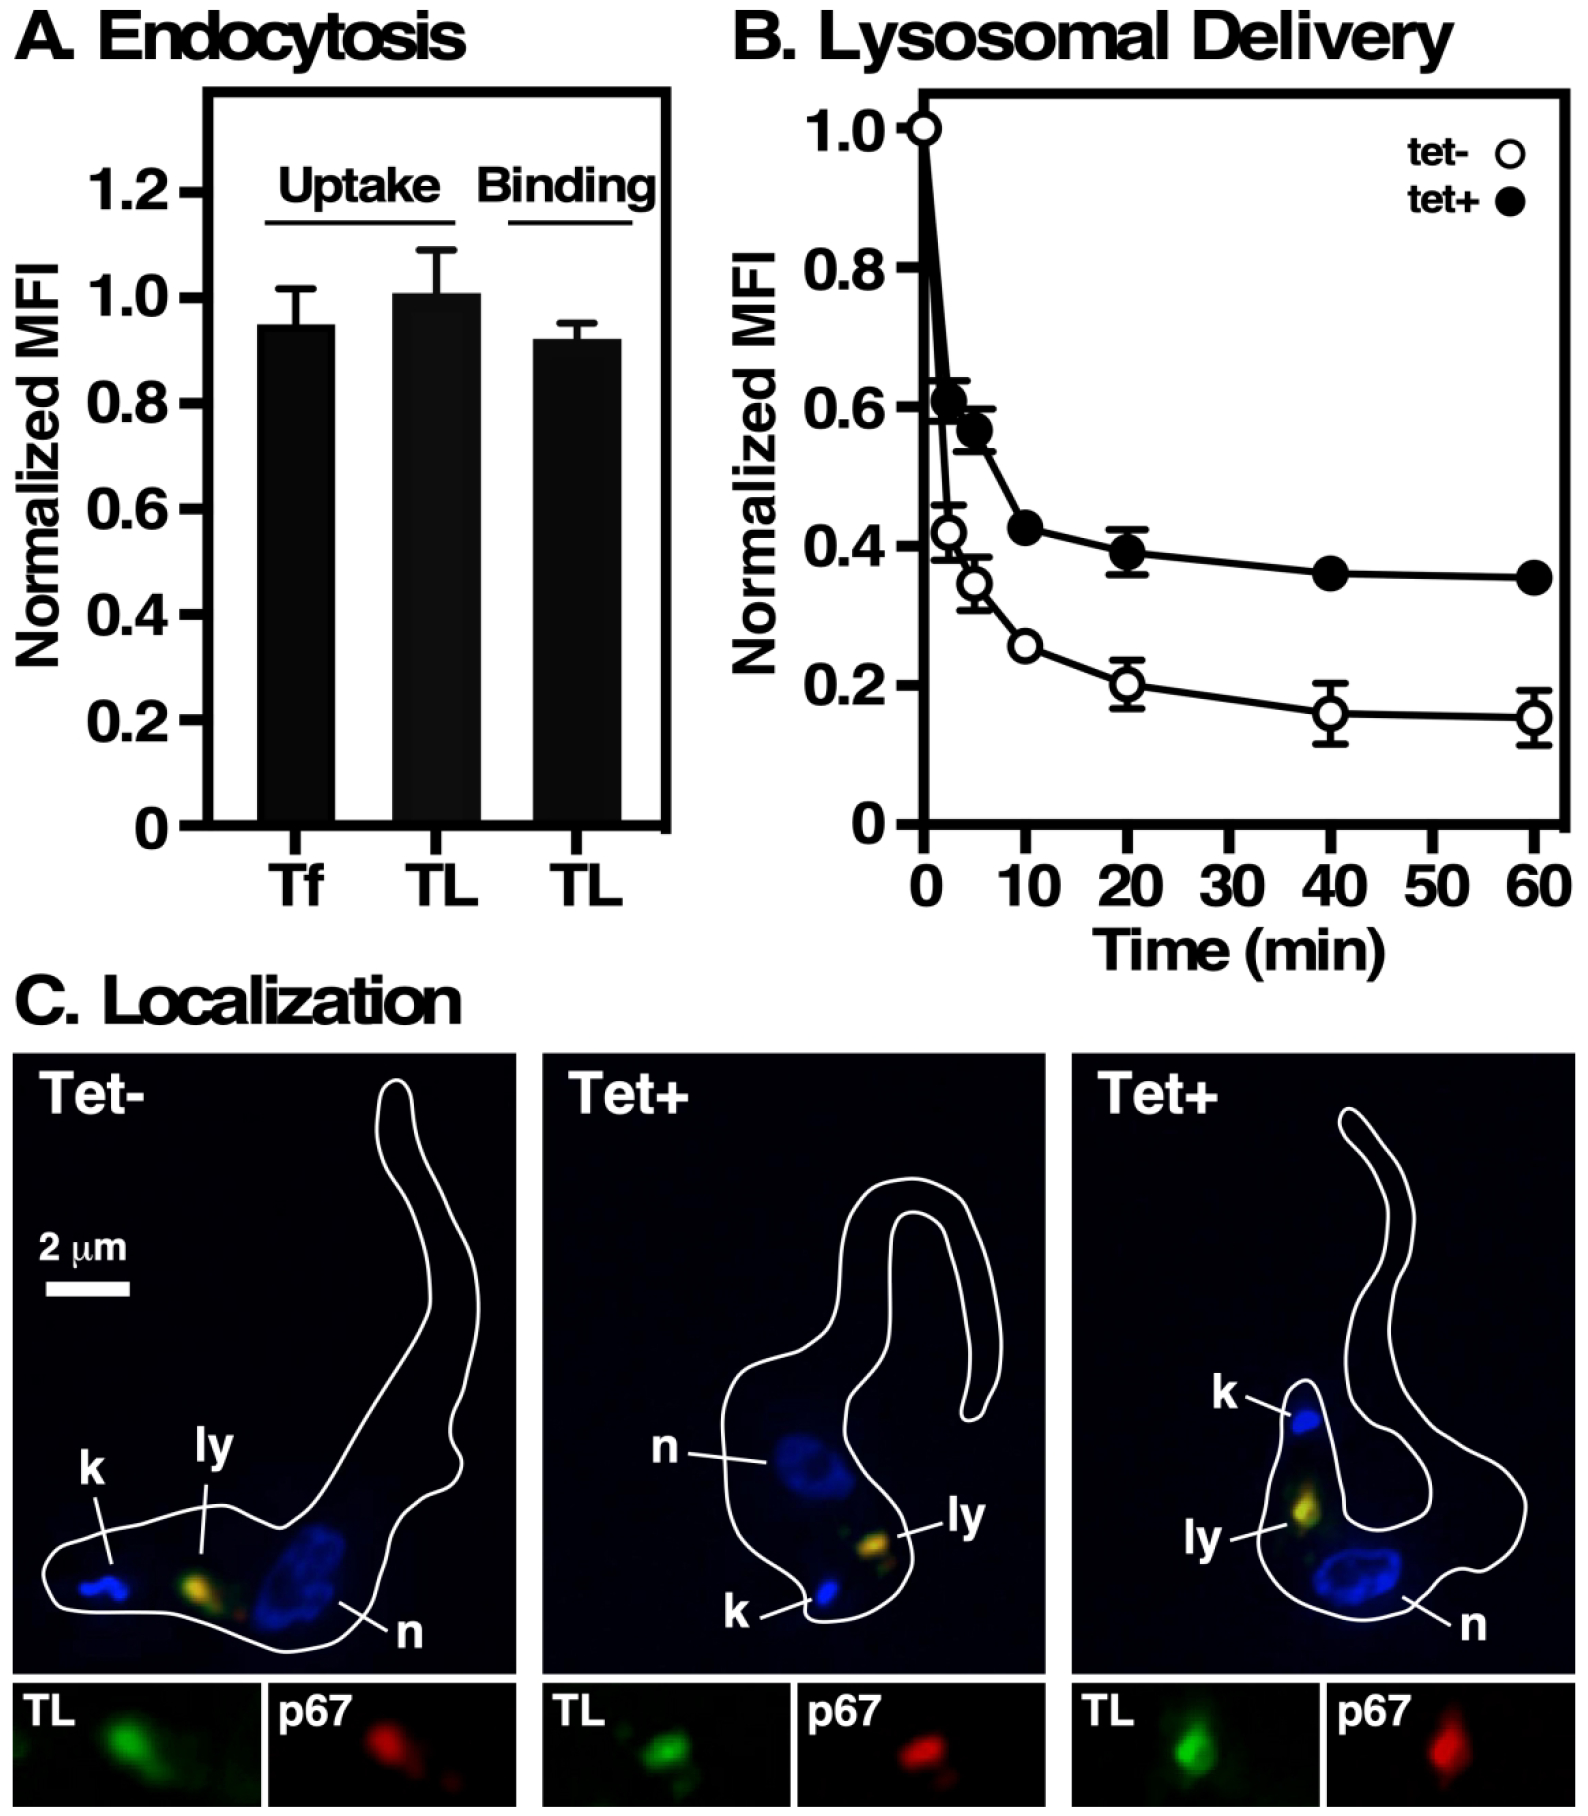
Fig 5. Effect of TbVps24 depletion on endocytosis.

Control and TbVps24 silenced cells (12 hr) were used for ligand binding and uptake assays as described in Materials and Methods. A. Binding (TL:A488 only) and uptake (Tf:A488 and TL:A488) of receptor-mediated endocytic cargo were measured by flow cytometry. Mean fluorescence intensities (MFI) normalized to control un-silenced cells are presented (mean ± std. dev., n=3 biological replicates). B. The kinetics of endocytosis was determined by pulse-chase uptake of the pH-sensitive probe TL:FITC. Cell-associated fluorescence of live cells was measured over time by flow cytometry. Data are normalized to initial bound ligand and are presented as MFI (mean ± std. dev., n=3 biological replicates). C. Cells were pulsed with TL:Bio (30 min, 37°C), washed, and then reincubated (20 min, 37°C) to chase the lectin probe into terminal endocytic compartments. Imaging was performed on fixed/permeabilized cells stained with anti-p67 (red) and streptavidin:A488 (green). Representative 3-channel images are presented of control (tet–) and silenced cells (tet+). Inserts are corresponding 1.5x single channel images of the lysosomal region. Cell outlines were captured from matched DIC images. Bar indicates 2 μm.
