


Figure 6. Vps24 depletion accelerates ISG65 turnover.
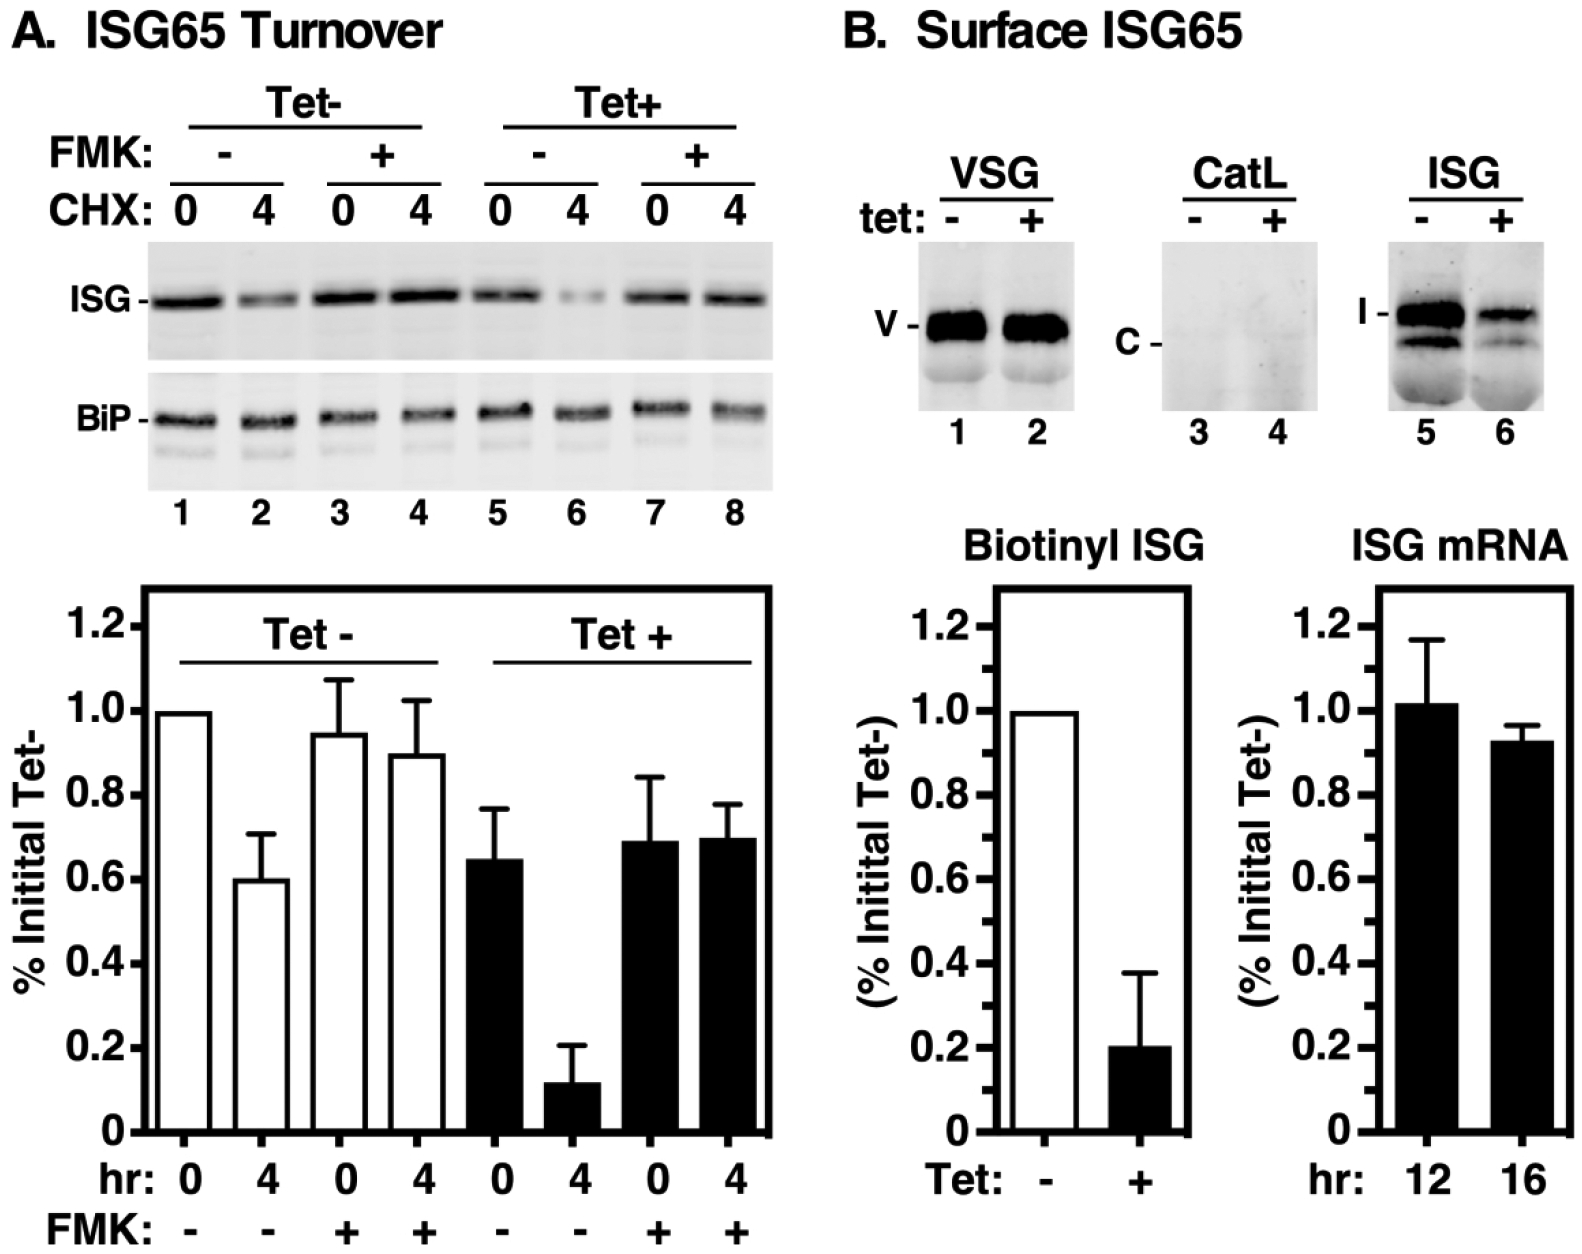
Turnover of endogenous ISG65 was analyzed in control (Tet–) and TbVps24 silenced (Tet+) cells (12 hr). A. Top. Protein synthesis was inhibited by treatment with cycloheximide and steady state levels of ISG65 were assayed by immunoblotting at 0 and 4 hrs of culture. As indicated FMK024 (20 μM) was used to block degradation in the lysosome. Parallel blots were performed with anti-BiP as a loading control. Representative blots (5×10⁶ cells equivalents per lane). Bottom. Quantification of ISG65 levels. ISG65 signals were normalized to BiP signals and corrected values were expressed as percentage of the initial signal for uninduced cells (mean ± std. dev., n=3 biological replicates). Control cells, white bars; silenced cells black bars. B. Top. Intact control (Tet–) and TbVps24 silenced (Tet+) cells were surface biotinylated and immunoprecipitated with anti-VSG221 (positive control), anti-TbCatL (negative control), and anti-ISG65. After fractionation by SDS-PAGE (ISG65 & TbCatL, 107 cell equivalents/lane; VSG221, 5×10⁴ cell equivalents/lane), blotting was performed with streptavidin-IR dye. Representative Li-Cor images are presented. Mobilities of VSG (V), TbCatL (C), and ISG65 (I) are indicated. Panels are from the same gel/image and were digitally separated after image processing. Bottom Left. ISG65 biotinylation was quantified and expressed as percentage of initial signal for uninduced cells (mean ± std. dev., n=3 biological replicates). Control cells, white bars; silenced cells black bars. Bottom Right. ISG65 mRNA levels were assessed by qRT-PCR at 12 (tet–) and 16 (tet+) hrs of TbVps24 silencing. Values are normalized to uninduced controls (mean ± std. dev., n=3 biological replicates)