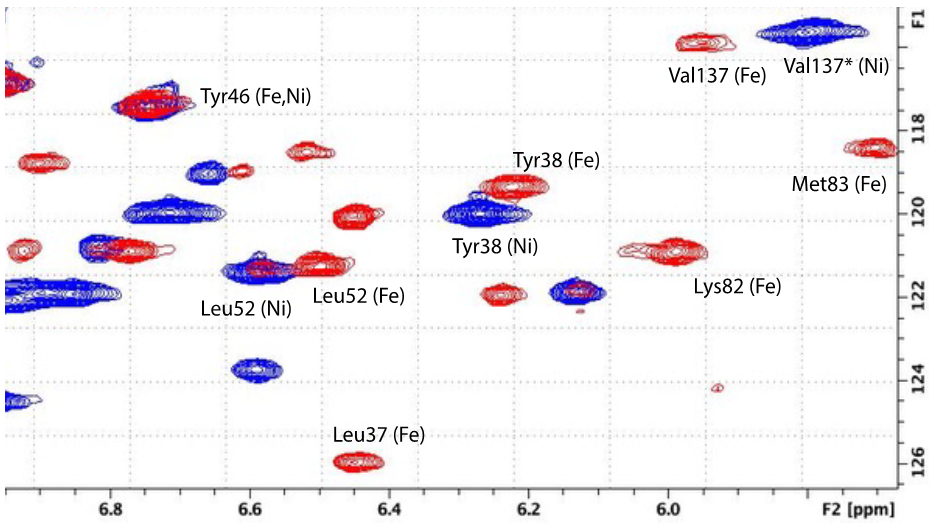
Figure 5.

Expansion of upfield region of 1H,15N TROSY HSQC spectra shown in Fig. 4, with NH correlations identified for Ni-bound (blue) and Fe-bound (red) HsARD. Note the shifts of Lys82 and Met83 in Fe-bound form (see text for details). The assignment of Val137 for Ni-HsARD (indicated by *) is unconfirmed.
