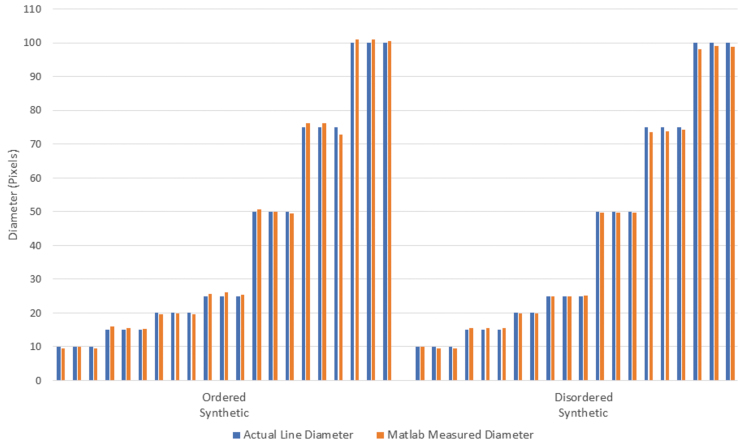
FIG. 5.
Bar graph displaying the actual diameter versus the diameter measured by using the SIMPoly method for each synthetic image. The average percent error between the measured and known diameters was 2.1% for the synthetic ordered images, and 1.6% for the synthetic disordered images. Color images are available online.

