
Exhibit 4. Adjusted in-hospital mortality rates for non-COVID-19 medical admissions in a group of US hospitals, by minority or poverty status in the patient’s ZIP code, February–June 2020.
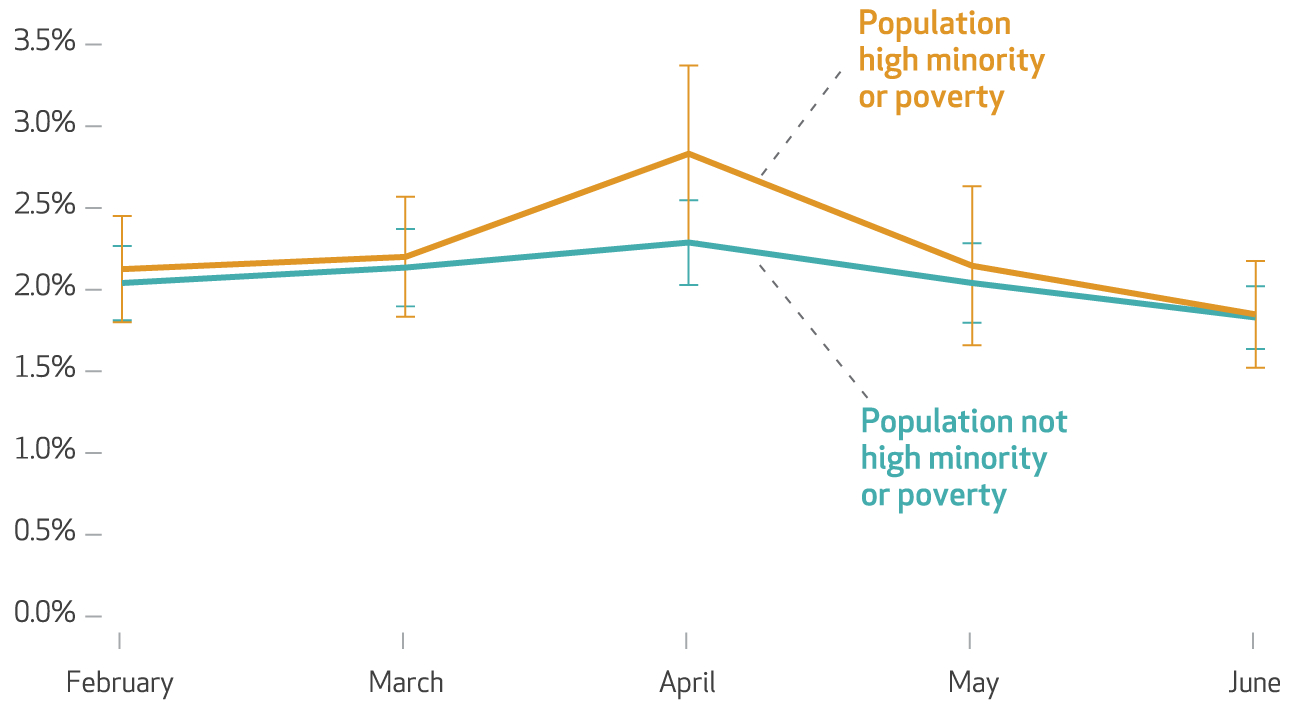
SOURCE Data from Sound Physicians hospital admissions. NOTES Data from 201 hospitals in 36 states. The orange (upper) line corresponds to estimates for patients living in ZIP codes with either majority-Black or majority-Hispanic populations or those with poverty rates higher than 25 percent; the teal (lower) line denotes all other patients. Estimates are from a logistic regression that adjusted for diagnosis, age, sex, and month by year by high-minority/poverty ZIP code categorical variables. The weeks correspond to months as follows: February (weeks 5–8), March (weeks 9–12), April (weeks 13–17), May (weeks 18–21), and June/July (weeks 22–26). Error bars represent 95% confidence intervals. The full regression analysis is in the appendix (see note 17 in text).