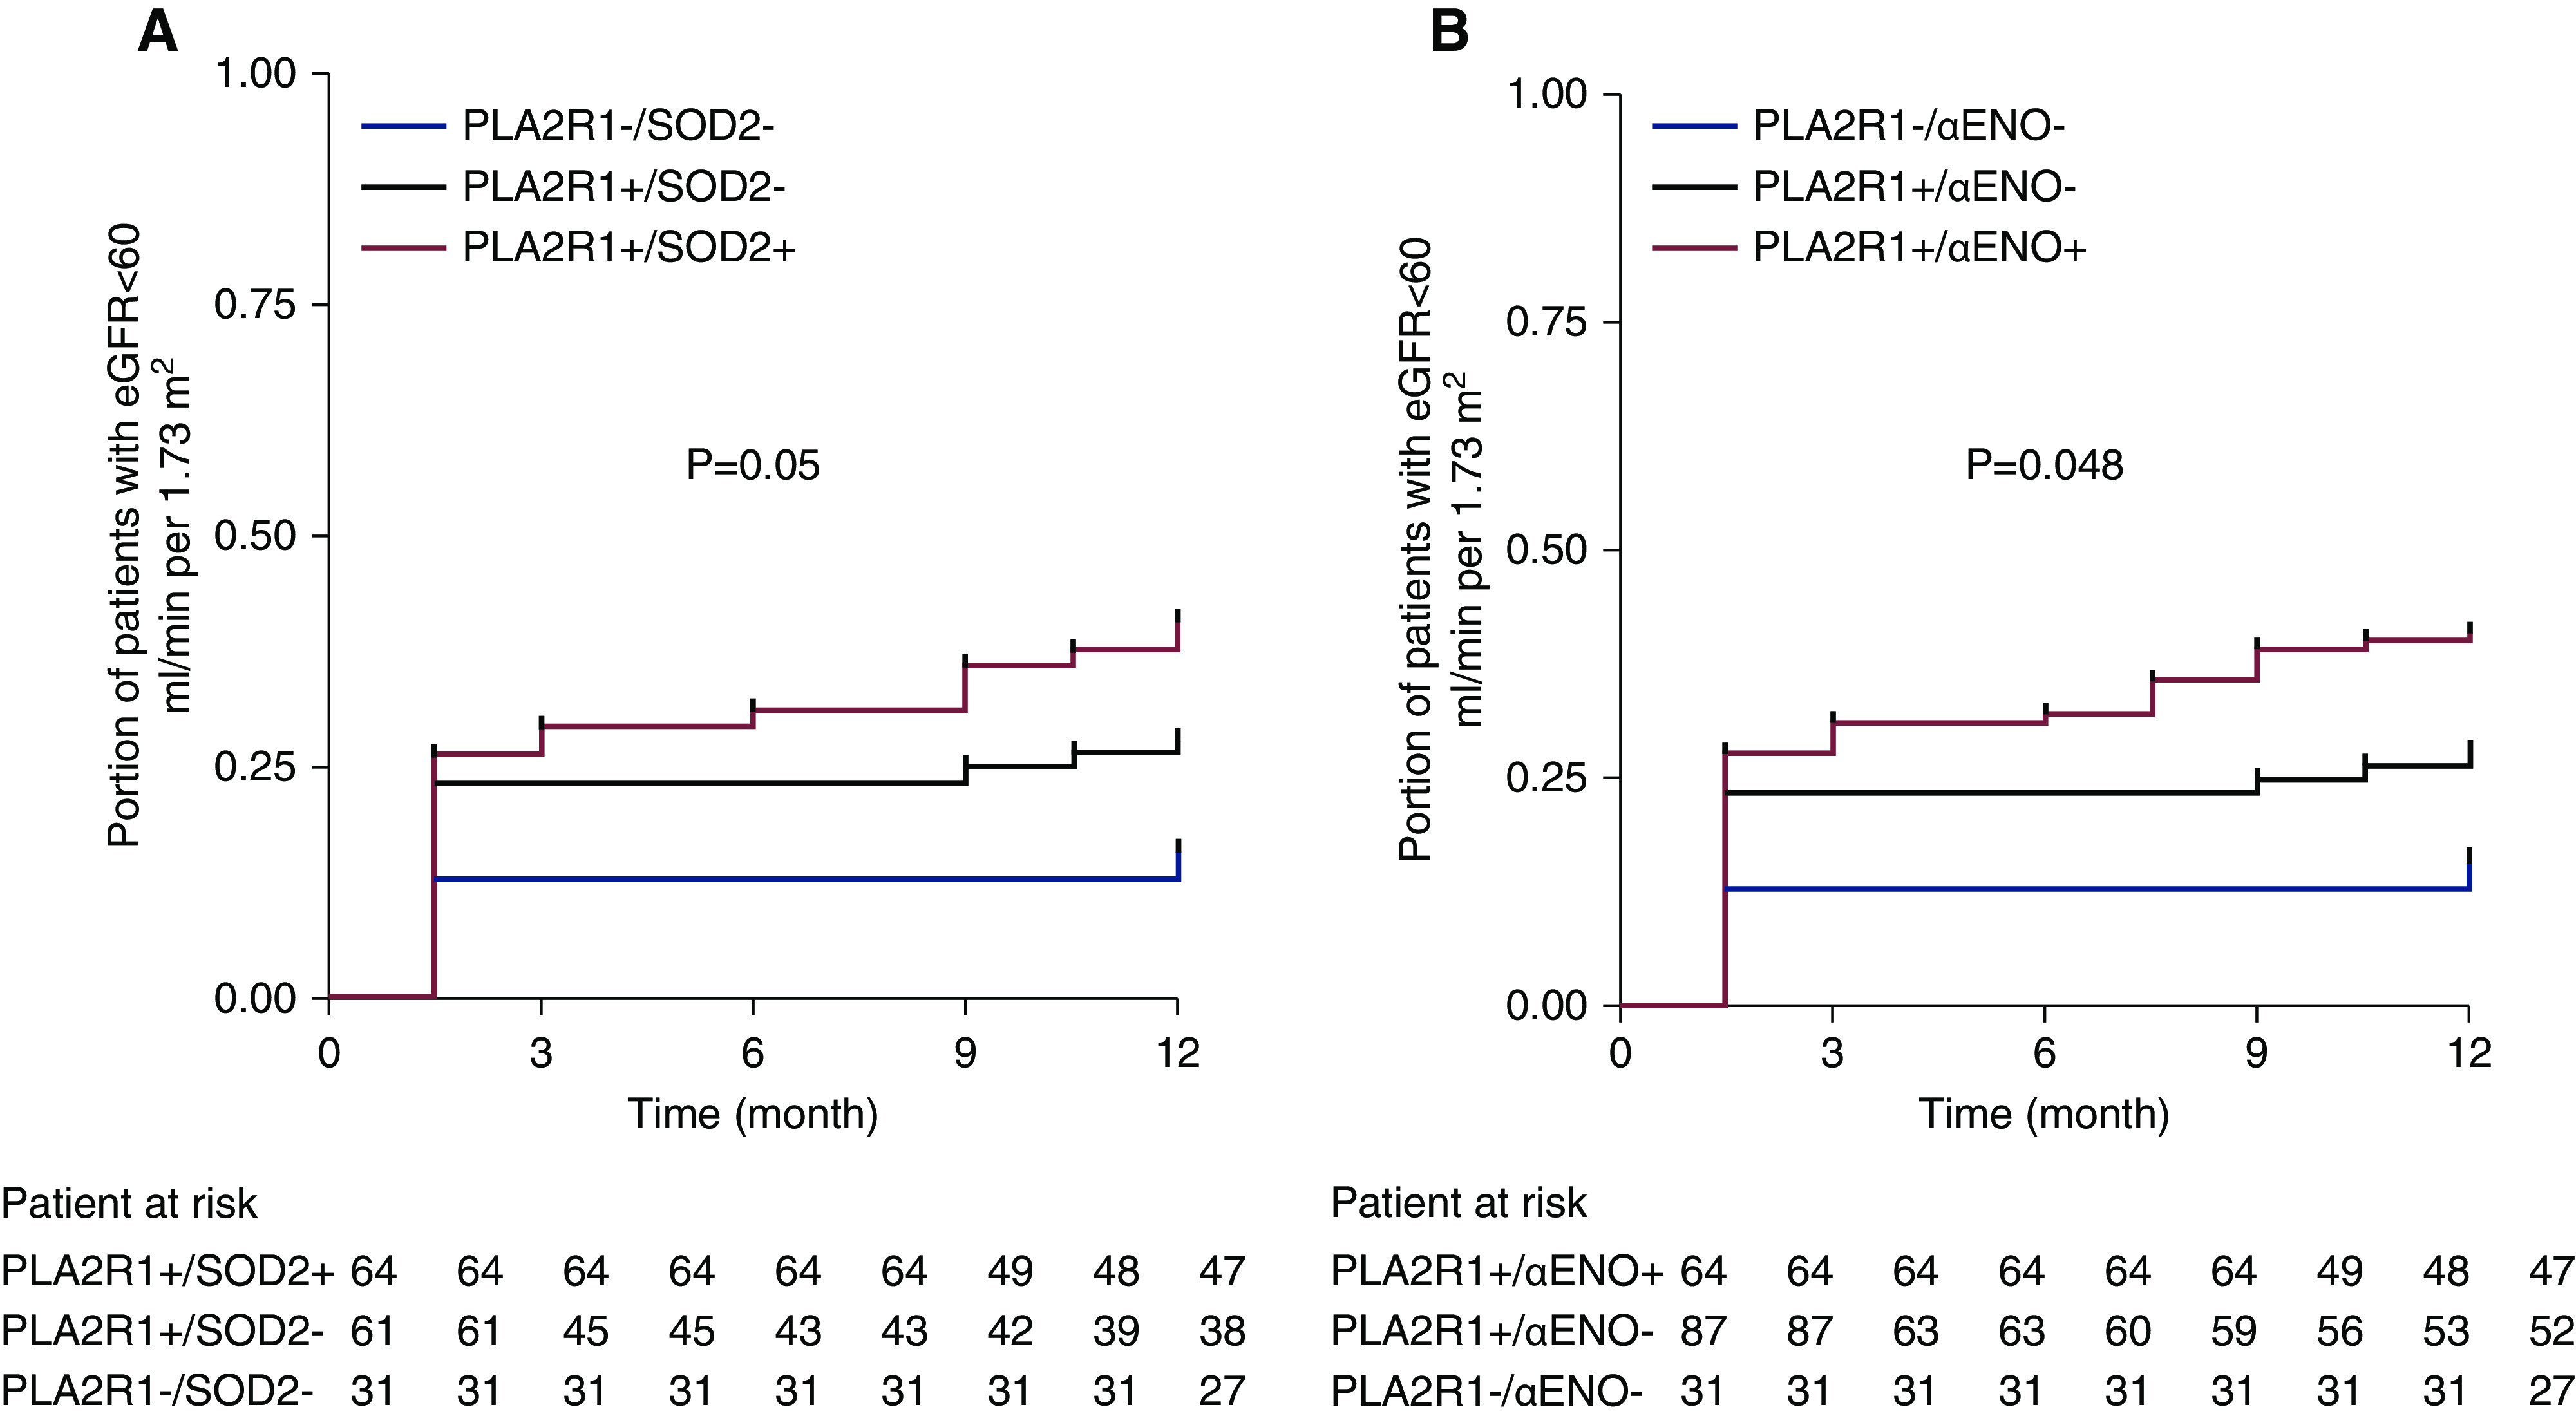
Figure 2.

Positivity for anti-SOD2 and anti-αENO has an additive effect with positivity for anti-PLA2R1 for decreased eGFR at 12 months. Kaplan–Meier curve showing the proportion of patients in the different groups who reached the endpoint of reduction of kidney function (eGFR <60 ml/min per 1.73 m2) after 12 months of follow-up based on the concomitant positivity or not for anti-PLA2R1 and anti-SOD2 (A) or anti-αENO (B). The Kaplan–Meier curve of the difference was calculated with the log-rank (Mantel-Cox) test and the hazard ratios with confidence intervals for the different groups.
