
Figure 1. Transcriptome Clustering Analysis Segregates Embryonic Meningeal Fibroblasts into Four Phenotypic Groups and Two Cycling Groups.
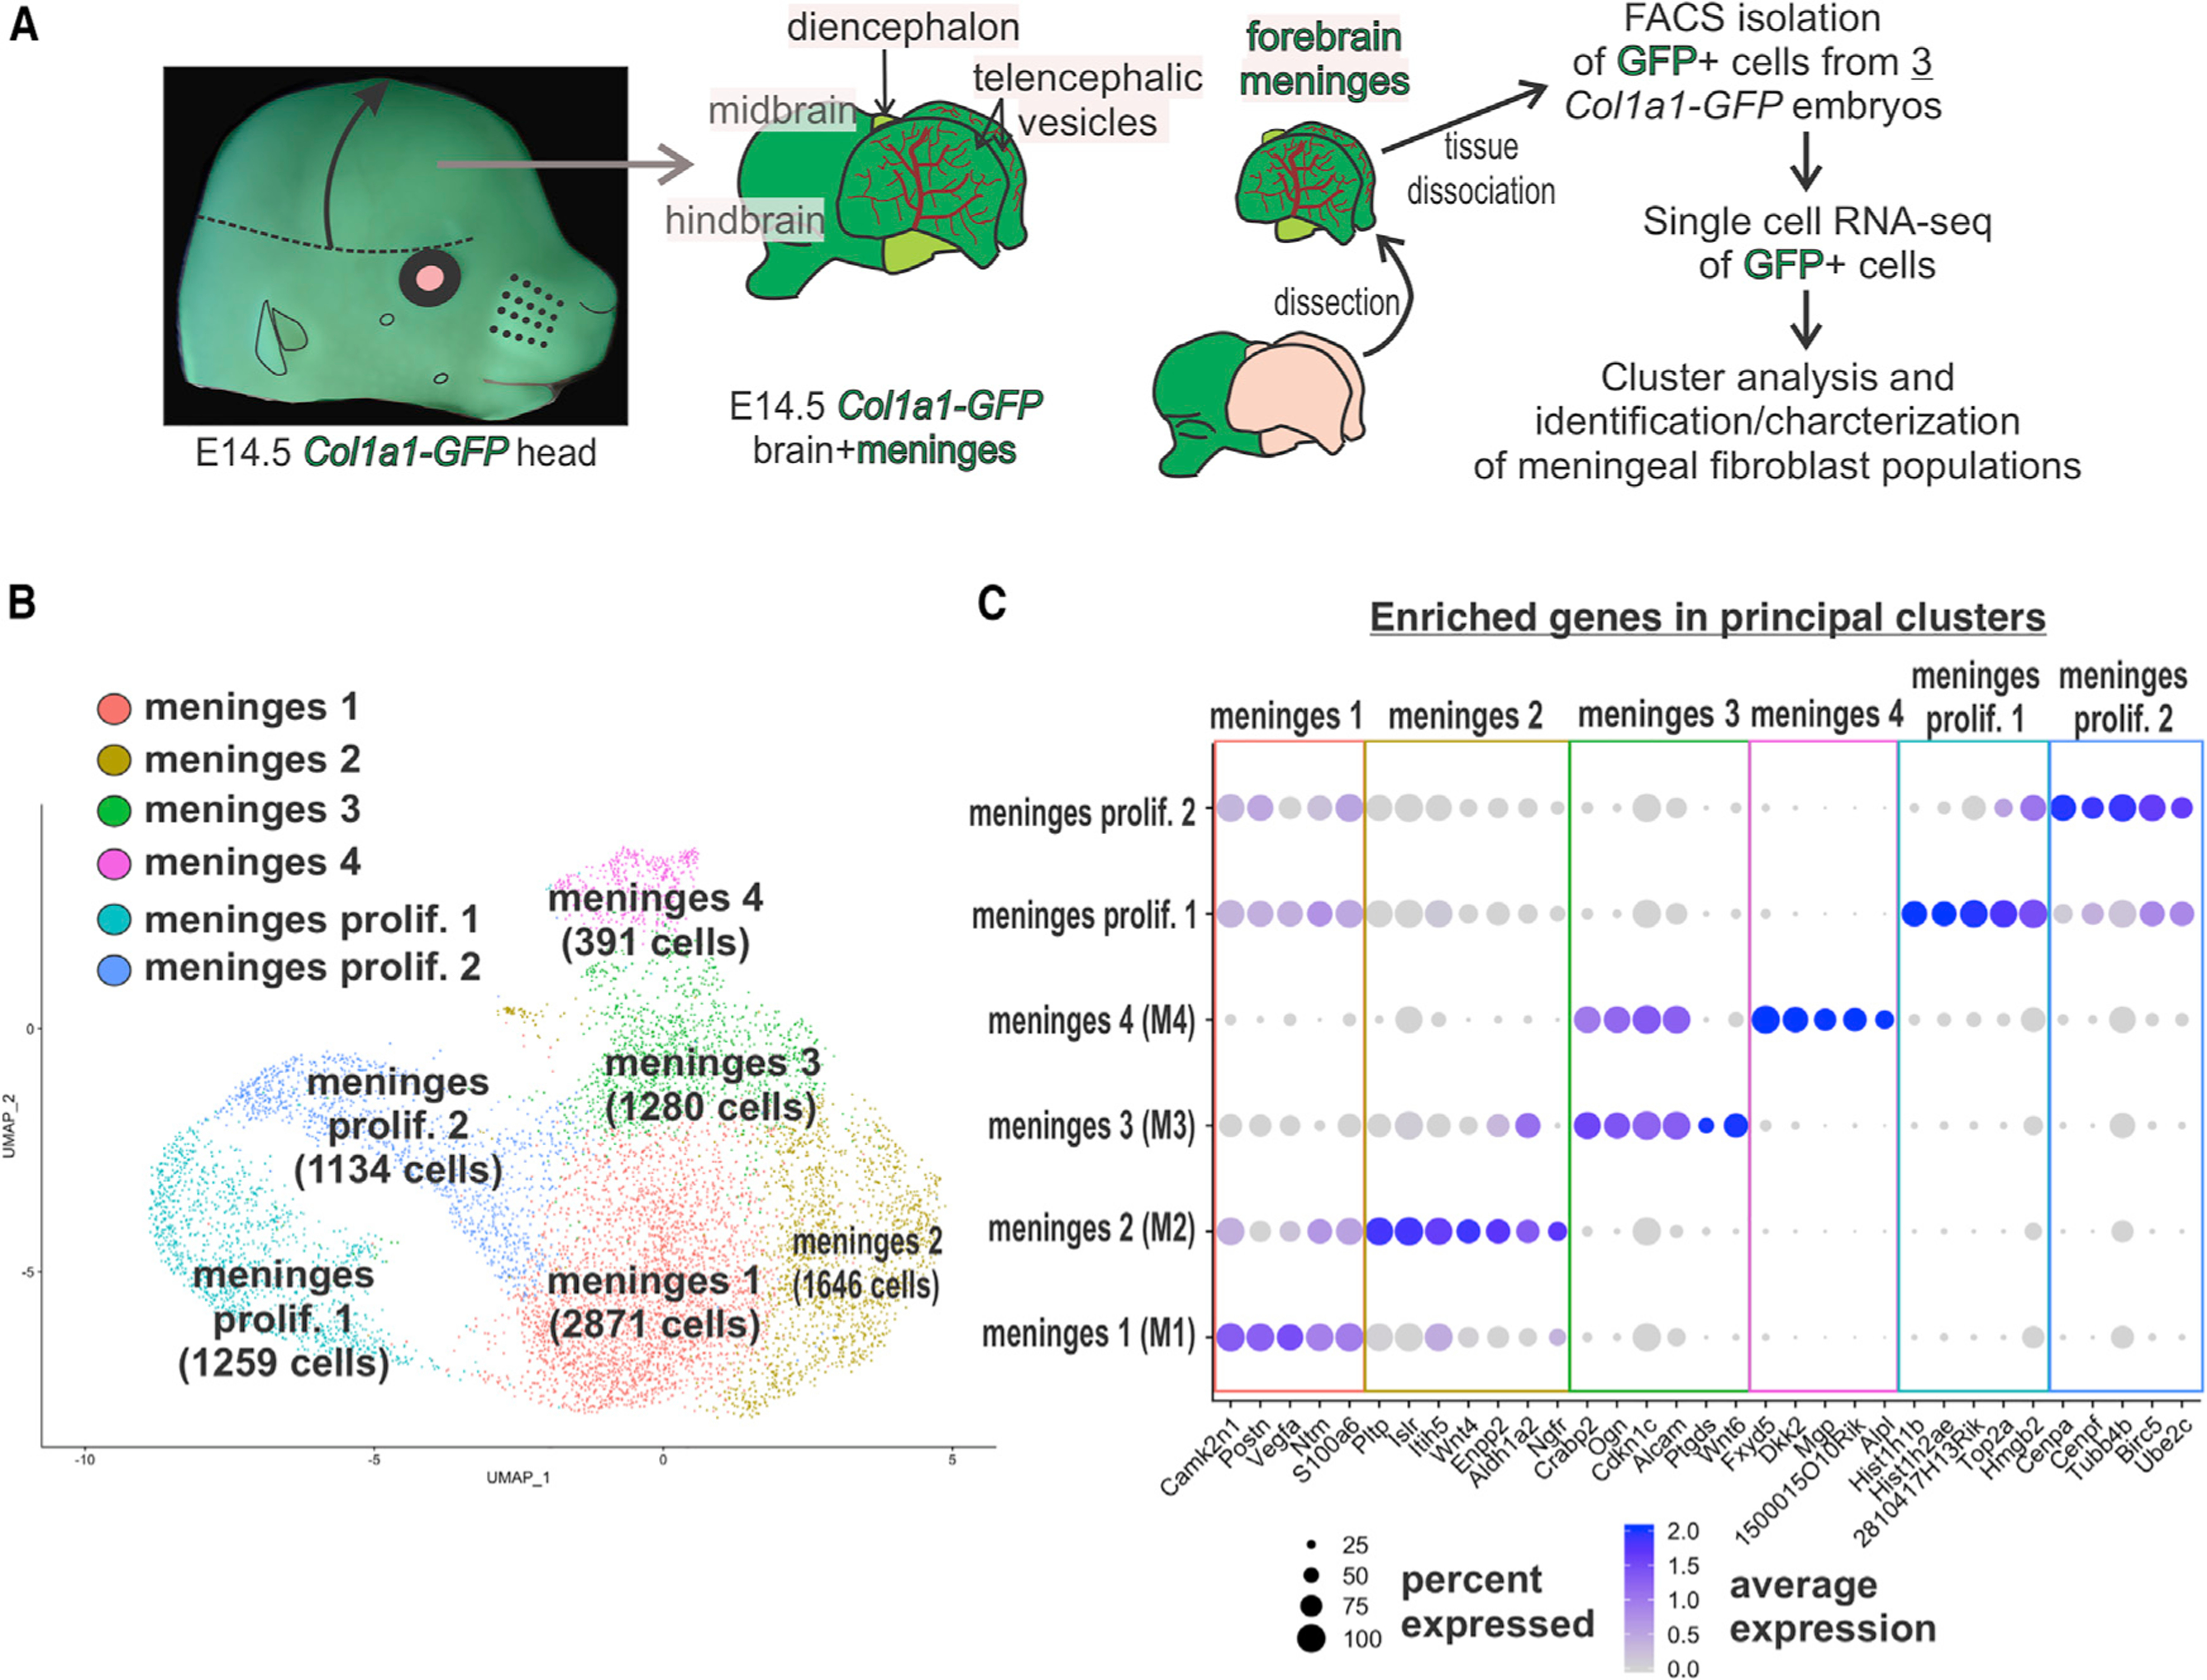
(A) Workflow of brain/meninges dissection, isolation, and single-cell RNA-seq analyses of E14 Col1a1-GFP+ meningeal fibroblast cells.
(B) UMAP clustering analysis resolved four principal phenotypic clusters and two clusters of dividing cells. Cell counts are shown in parentheses.
(C) Dot plot depicting enriched genes, curated from the top 30 based on adjusted p value, in each of the principal cell clusters. Dot color represents average expression level, and size represents percentage of cells expressing each marker.