
Figure 2. Genes Enriched in Principal Clusters Encode for Proteins Expressed in Specific Meningeal Layers.
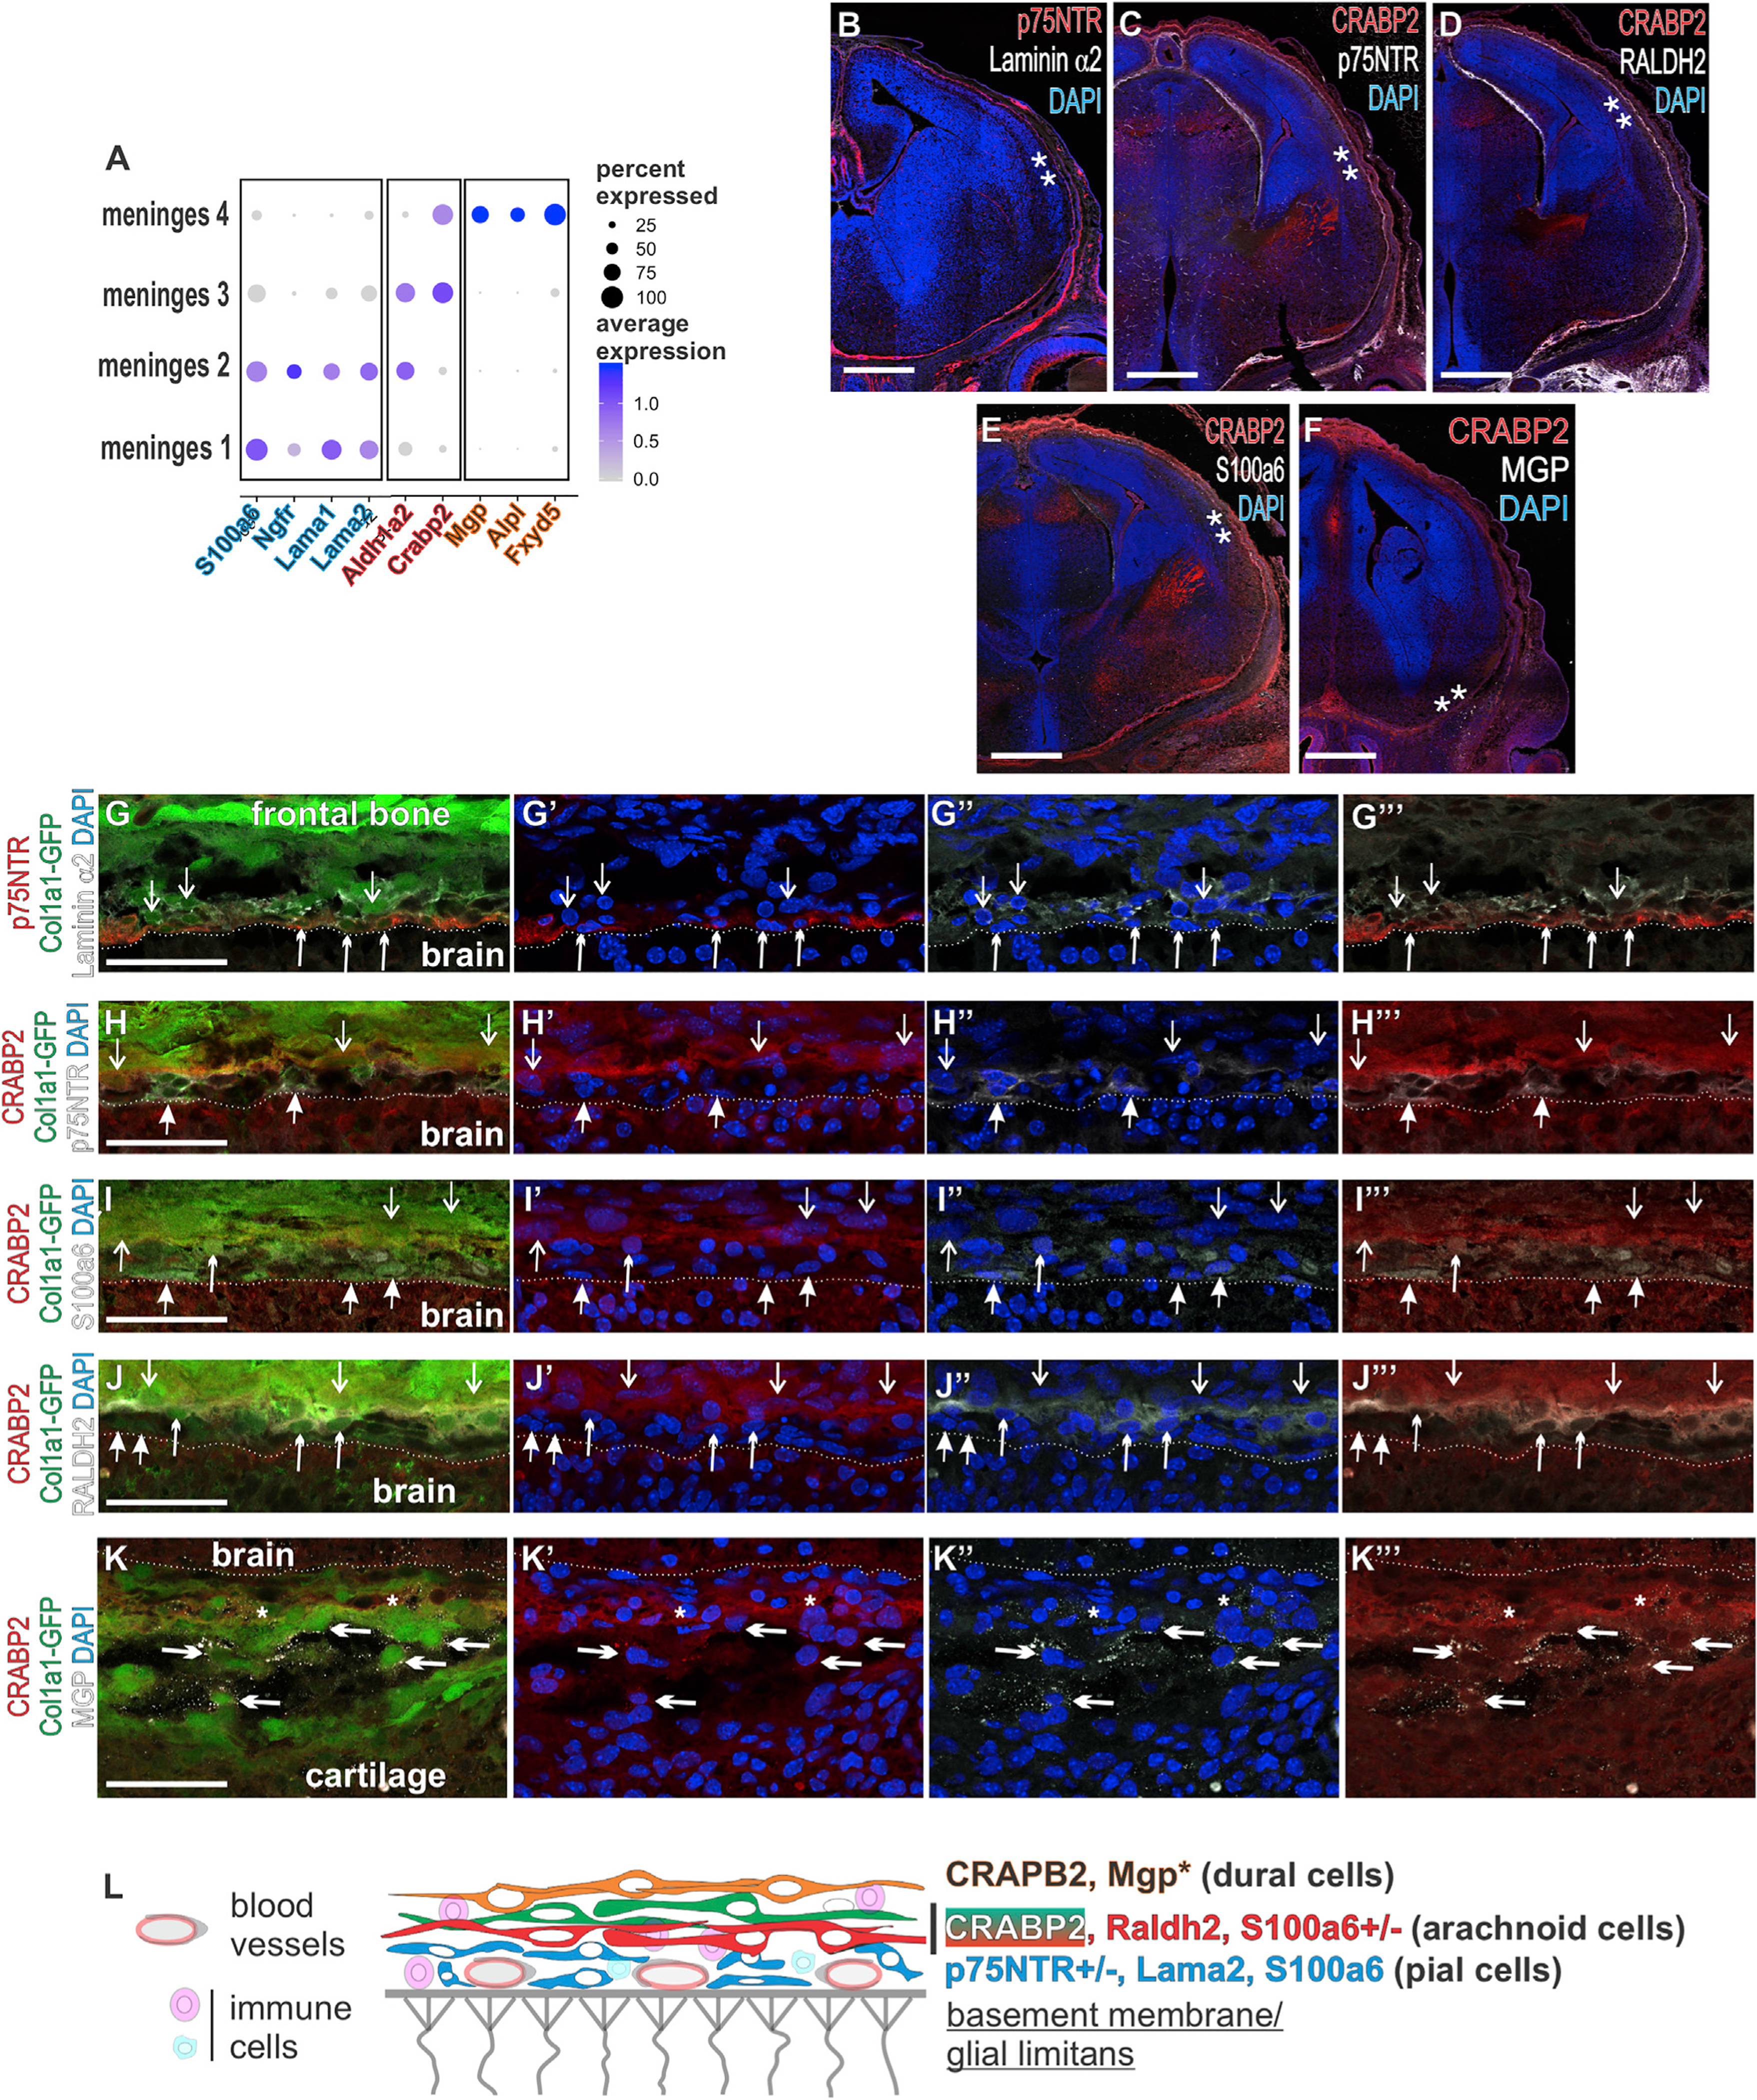
(A) Dot plot depicting select genes enriched in principal clusters and validated by protein expression. Colored type denotes cluster-enriched markers: meninges 1 and 2, blue; meninges 2/3, pink; meninges 4, orange.
(B–F) Coronal sections of the forebrain depicting immunolabeling of meninges enriched genes. ** indicates locations of high-resolution images in (G–K).
(G) Laminin α2+/p75NTR+/GFP+ are indicated by upward short arrowheads and laminin α2+/GFP+ by downward open arrows.
(H) CRABP2+/GFP+/p75NTR cells are indicated by downward open arrows, and p75NTR+/GFP+/ CRABP2– are indicated by upward closed arrows.
(I) S100a6+/GFP+/ CRABP2– are indicated by an upward closed arrow, the S100a6+/GFP+/CRABP2+ cell is indicated by an upward short arrowhead, and CRABP2+/S100a6-/GFP+ layers are indicated by downward open arrows.
(J) Raldh2+/CRABP2+/GFP+ are indicated by upward short arrowheads, Raldh2– / CRABP2– /GFP+ are indicated by upward closed arrows, and CRABP2+/RALDH2– /GFP+ cells are indicated by downward open arrows.
(K) Short arrowheads indicate MGP+/CRABP2+/GFP+ cells immediately adjacent to a CRABP2+/GFP+/MGP– arachnoid layer, though some cells in this layer were MGP+ (open arrow).
(L) Summary diagram showing the expression of meninges layer enriched proteins depicted in (G–K).
MGP* indicates that protein expression was only observed ventrally. Dotted line indicates brain surface in (G–K). Scale bars represent 500 μm in (B–F) and 50 μm in (G–K). Dot color represents average expression level, and size represents percentage of cells expressing each marker.