
Figure 3. Unbiased Hierarchal Analyses Confirm Distinct Transcriptional Signatures between Pia, Arachnoid, and Dura Fibroblasts.
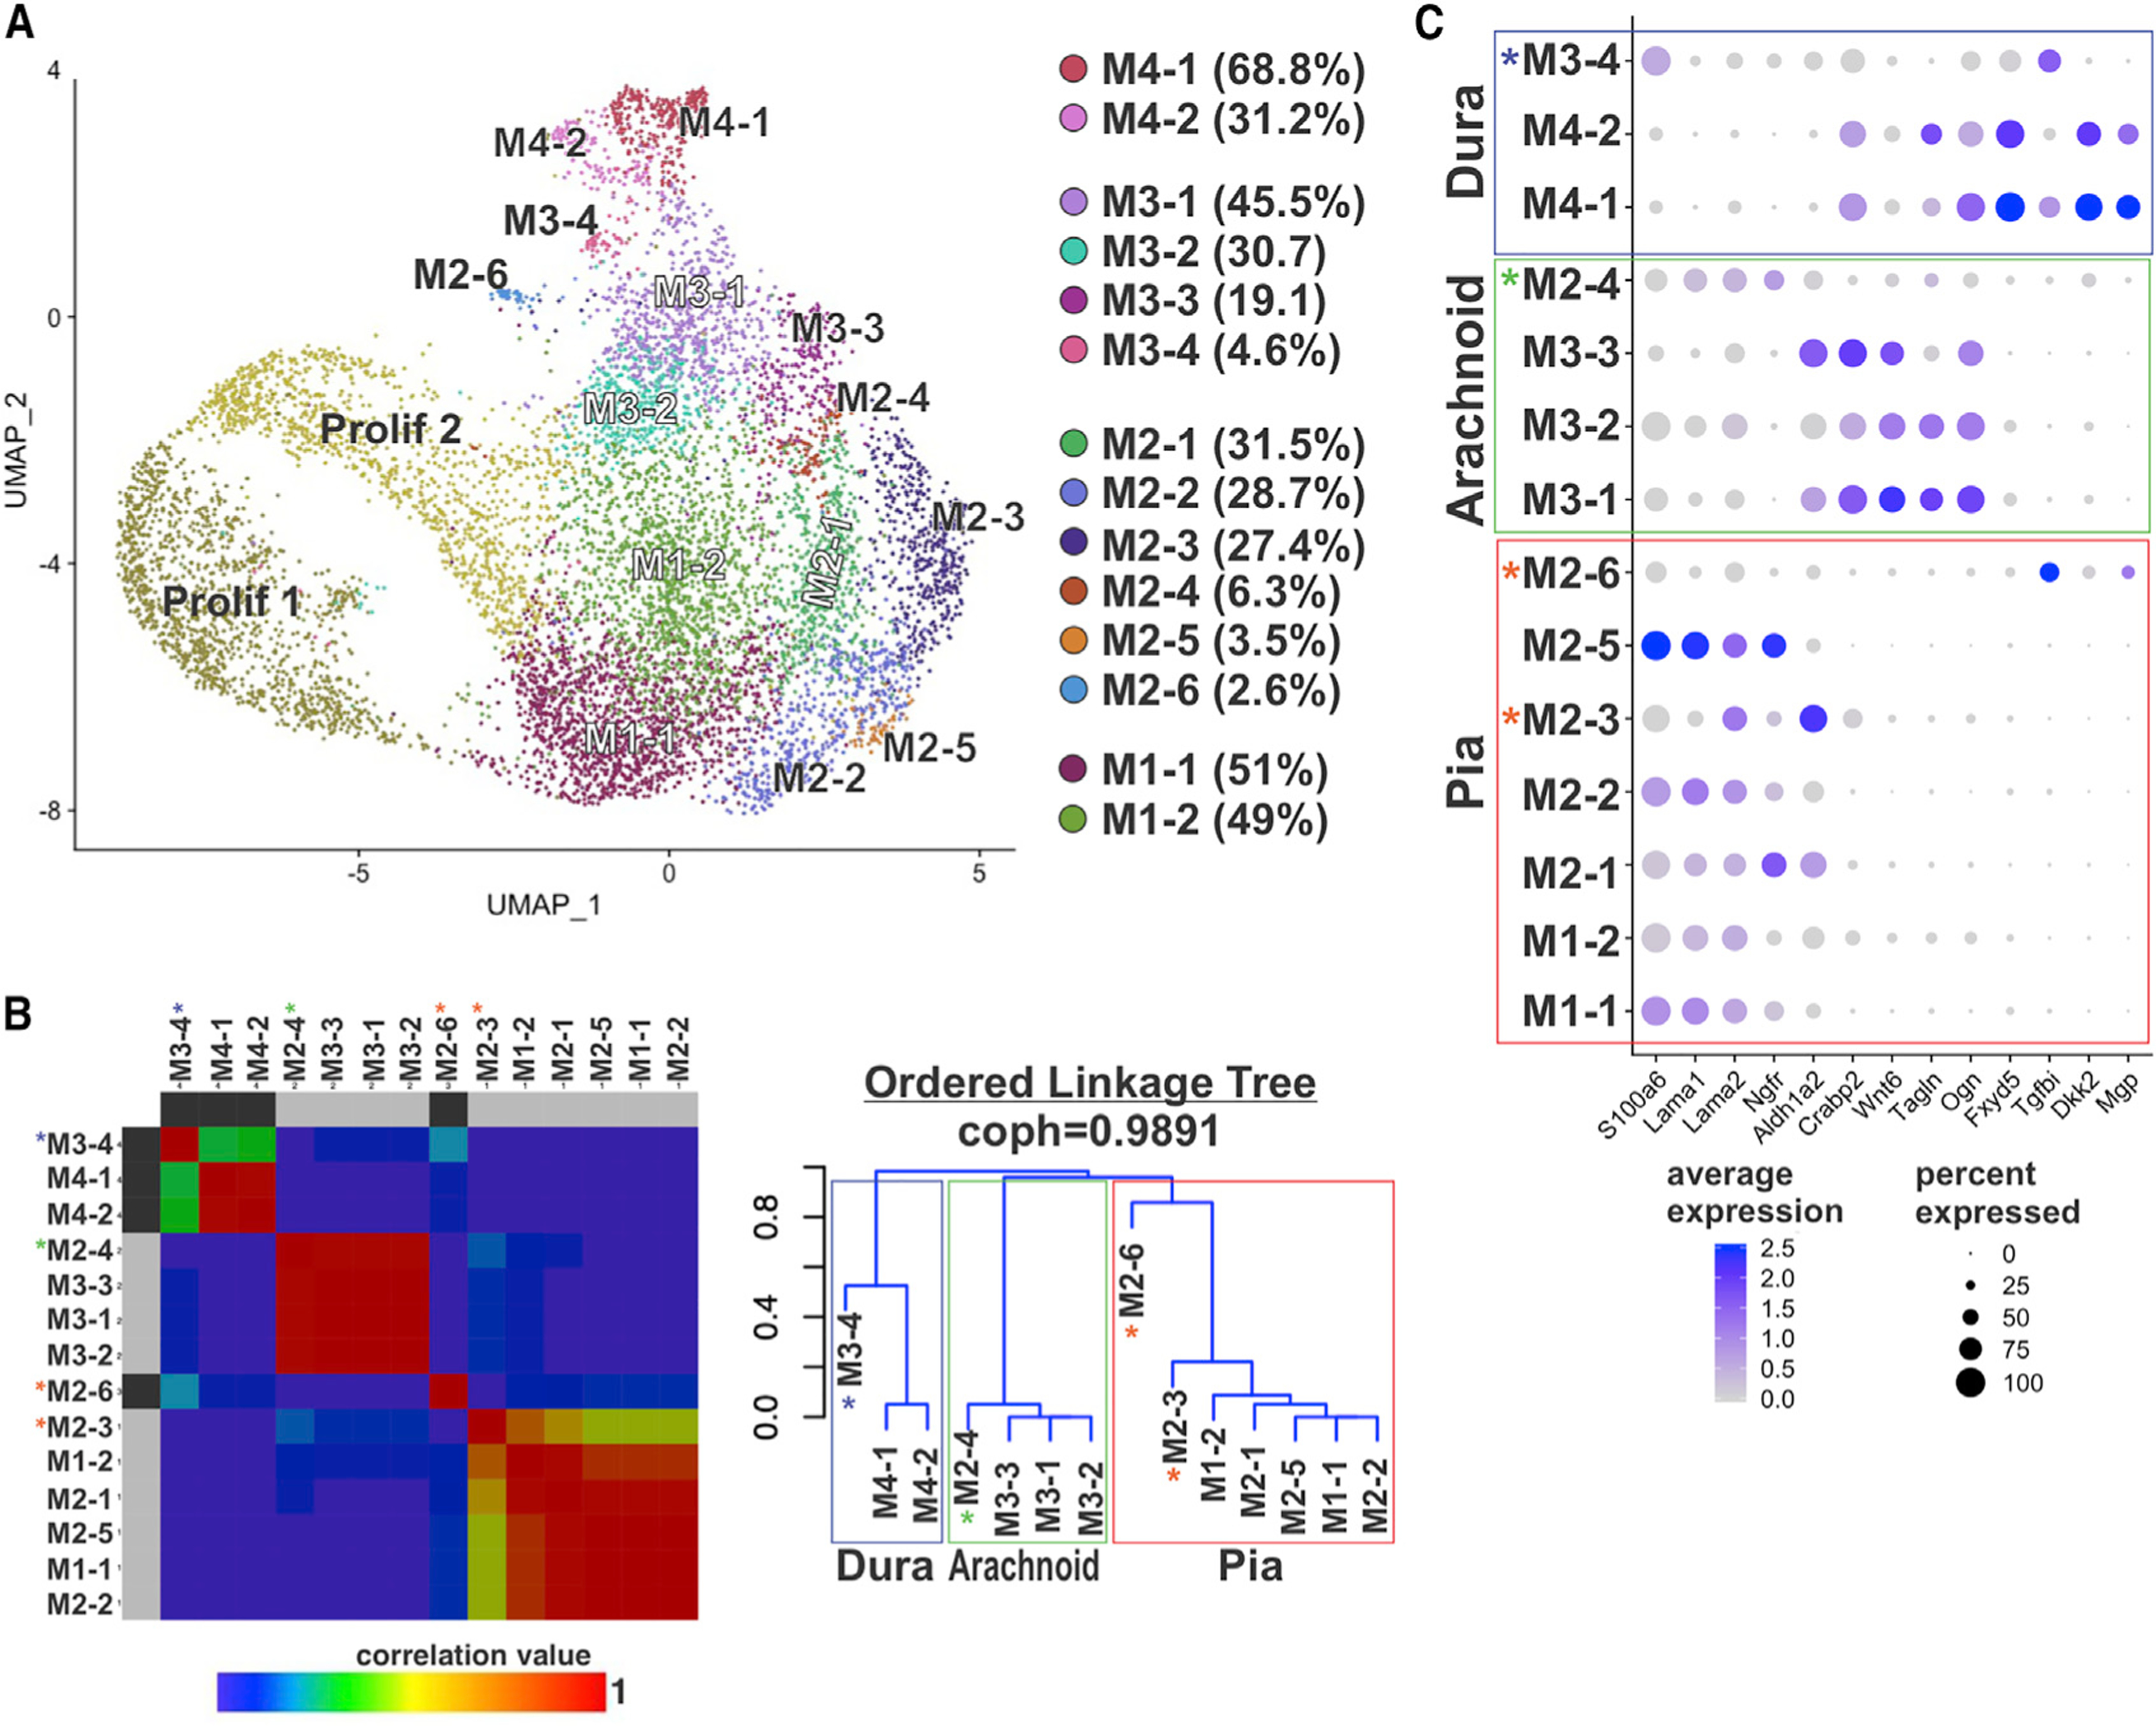
(A) UMAP annotated with 14 subclusters identified by analysis of principal clusters M1–M4. Percentage of cells per subcluster relative to the principal cluster is indicated in the legend.
(B) Non-negative matrix factorization (NMF) matrix and linkage tree or cladogram showing hierarchical relationships among M1–M4 subclusters. Cophenetic correlation is maximized for k = 4. Colors represent correlation values based on consensus clustering that range from 0 (blue, samples are never in the same cluster) to 1 (red, samples are always in the same cluster). Cladogram branches are annotated to indicate “pia” (red), “arachnoid” (green), and “dura” (blue) populations. Asterisks indicate subclusters that are transcriptionally distinct from other subclusters in the “pia” (red asterisk), “arachnoid” (green), and “dura” (blue) clades.
(C) Dot plot depicting genes enriched in pia, arachnoid, and dura subclusters. Dot color represents average expression level, and size represents the percentage of cells expressing each marker.