
Figure 4. Subcluster Enriched Genes Localize to Specific Regions of the Embryonic Meninges.
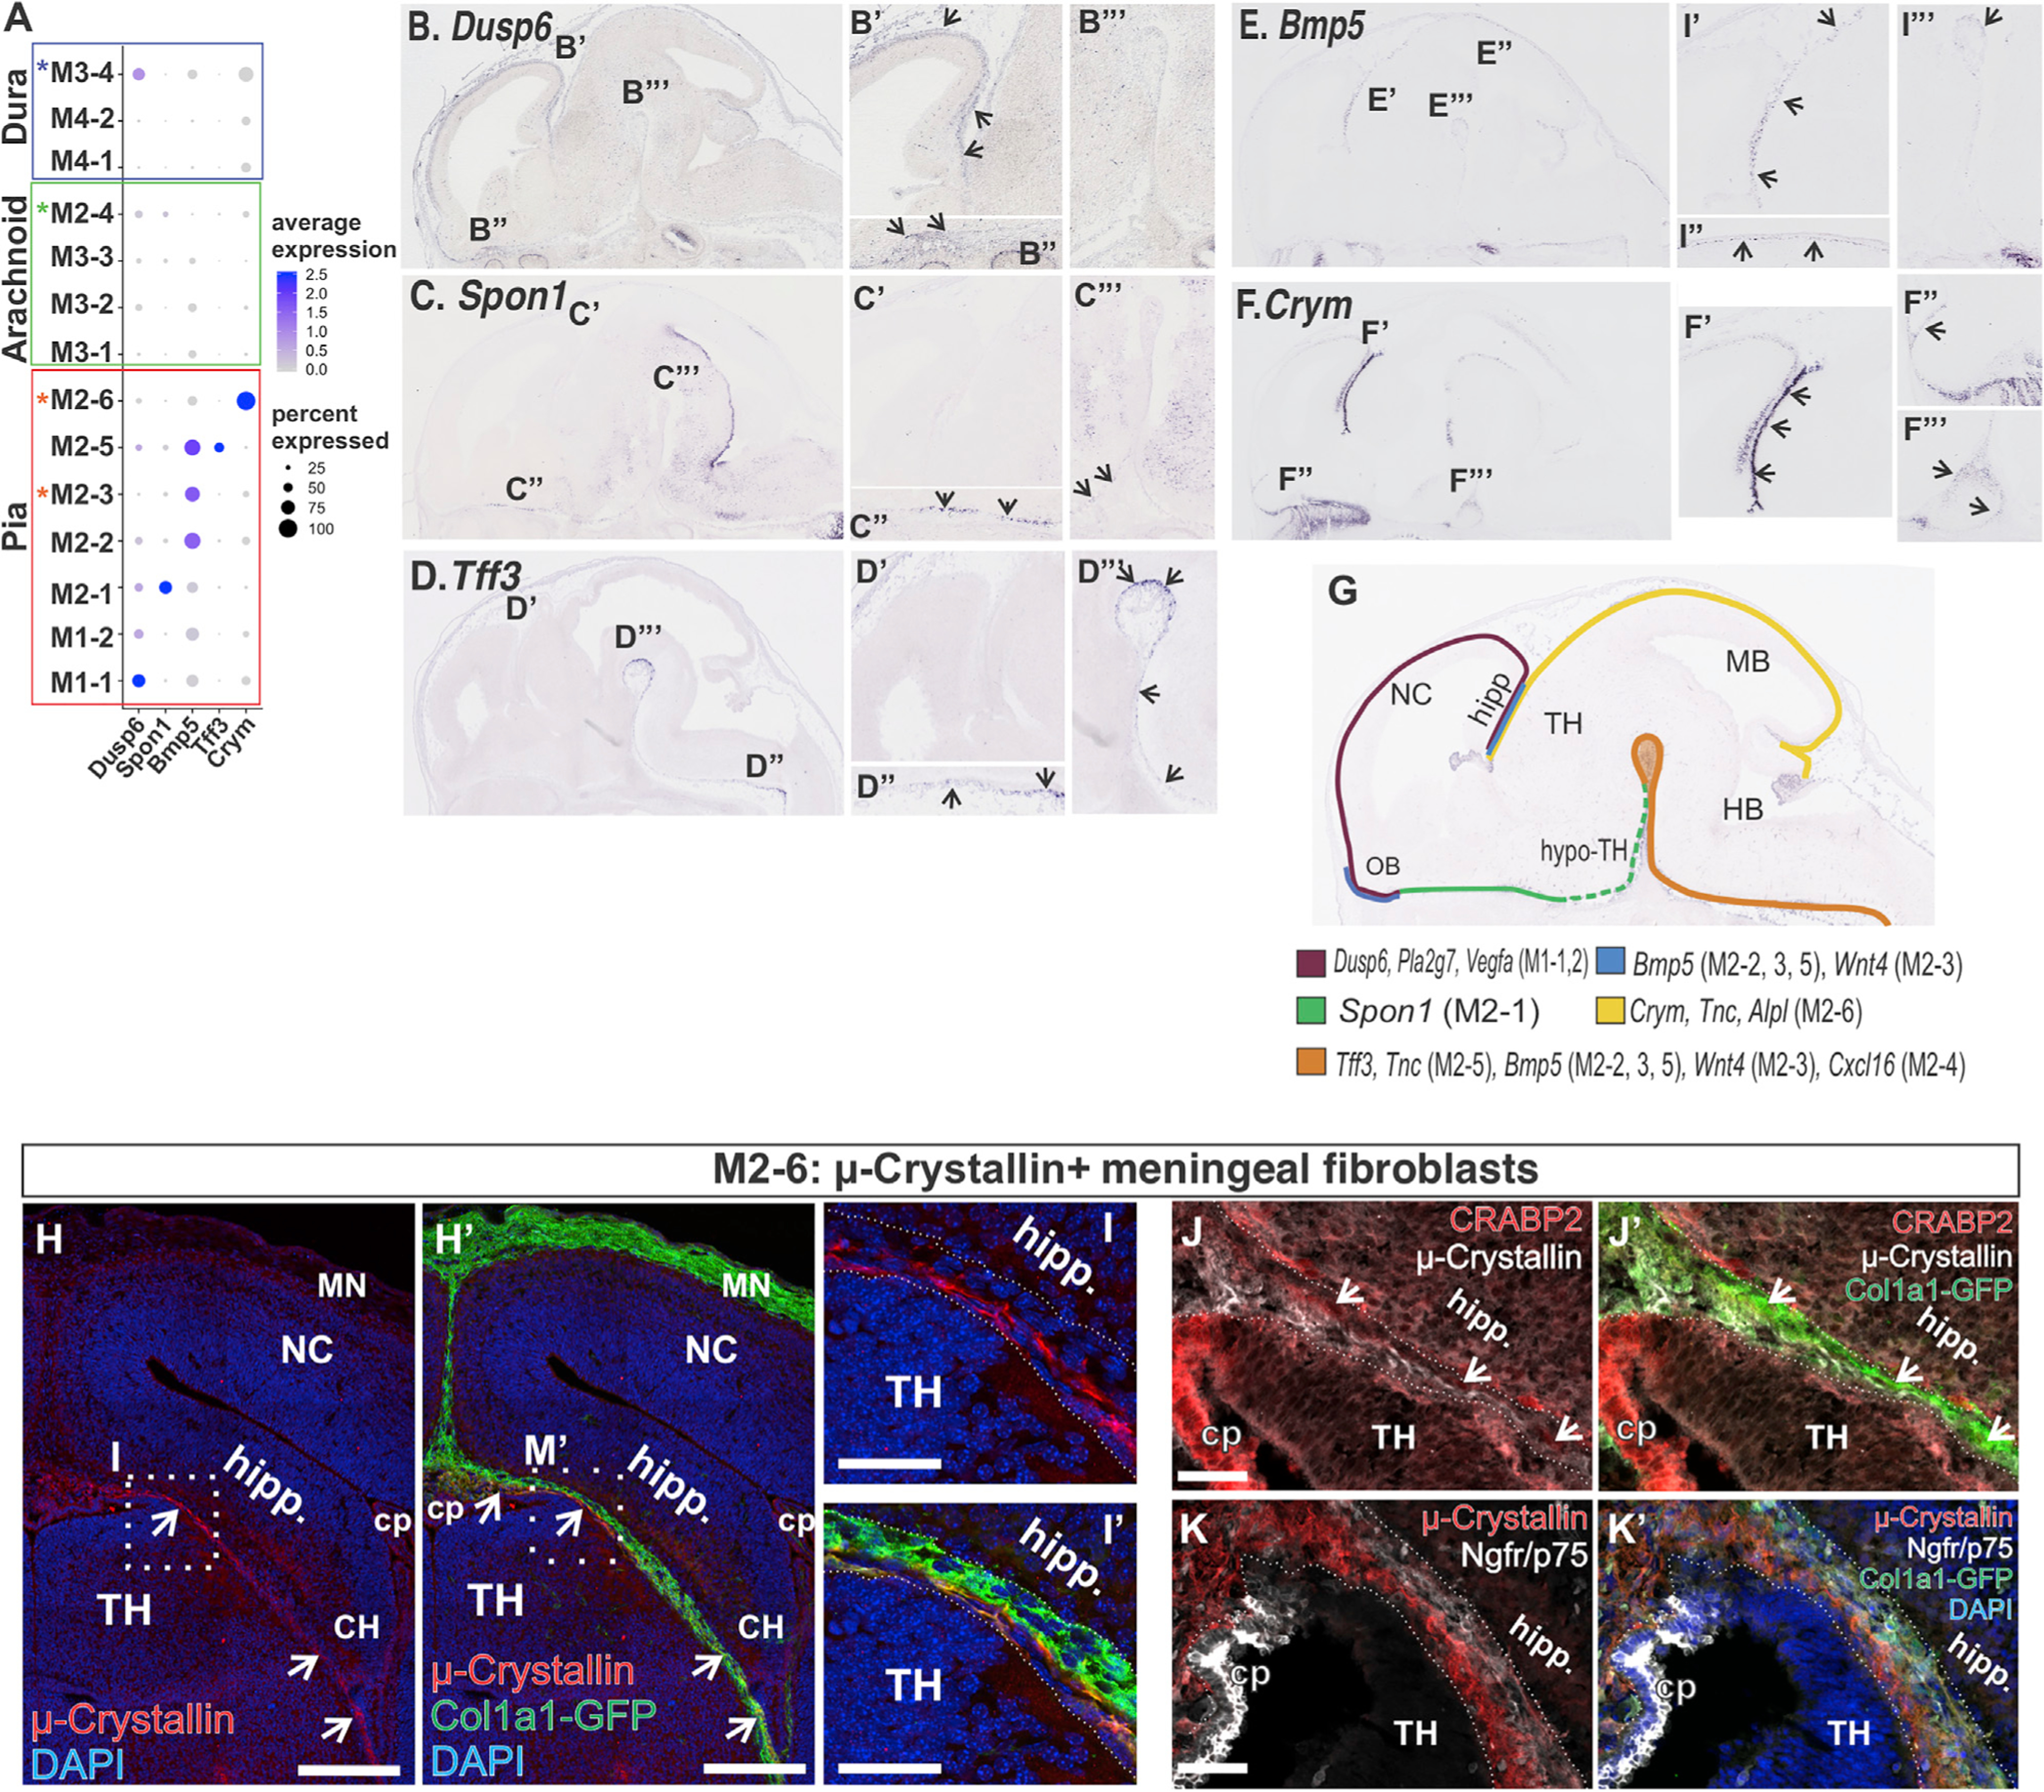
(A) Dot plot depicting genes differentially enriched in M1 and M2 subclusters (B–F) In situ gene expression in E14 sagittal sections depicting the expression of genes identified as enriched in M1 and M2 subclusters. Areas that are magnified are indicated on the low-magnification image in (B–F). Arrows indicate signal detected in meninges.
(G) Summary of meninges expression pattern of subcluster enriched genes based on (F–J) and Figure S4.
(H–M) (L and M) Col1a1-GFP E14 coronal brain section depicts μ-crystallin+/GFP+ cells in the meninges between the future hippocampus and thalamus. Magnified areas in (M and M′) are indicated by a box in (L and L′). (H and I) Col1a1-GFP E14 coronal brain section depicting μ-crystallin+/GFP+ cells in the meninges immediately adjacent to the surface of the thalamus. μ-crystallin+/GFP+ cells are separate from CRABP2+ (arrows in J) or p75NTR+ layers in this region but extend into the choroid plexus (CP) (K). Scale bars represent 200 μm in (H) and 50 μm in (I–K); TH, thalamus; Hipp, hippocampus; MN, meninges; NC, neocortex; CP, choroid plexus. Dot color represents the average expression level, and size represents the percentage of cells expressing each marker.