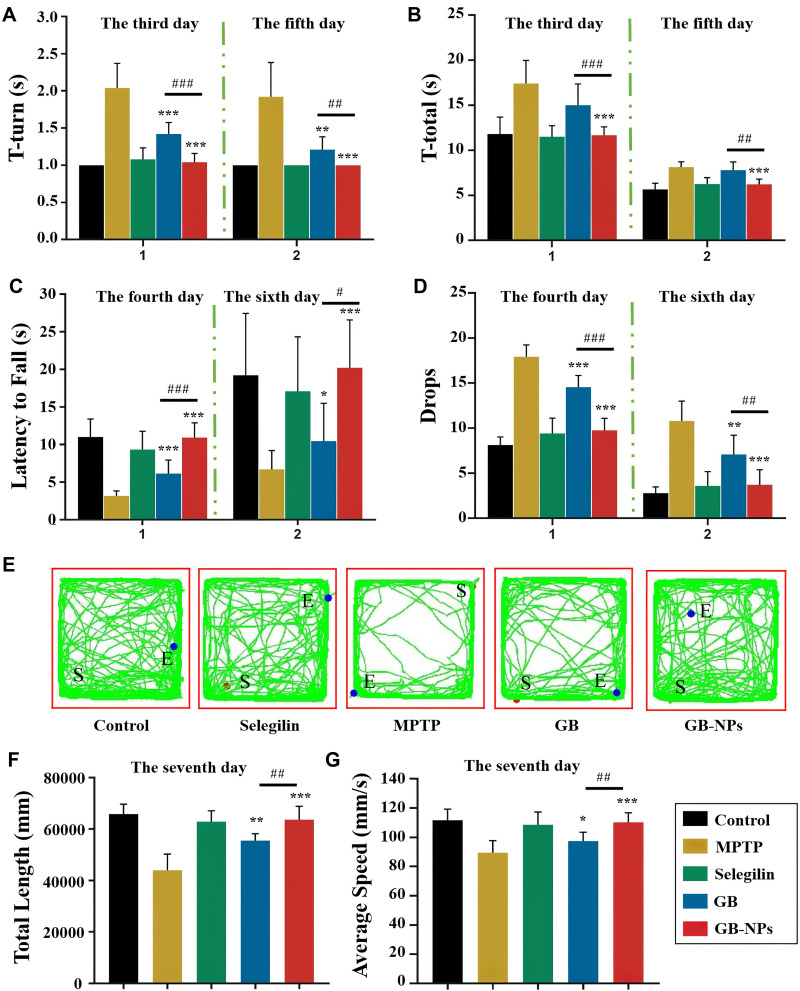
Figure 7.
The impact of GB-NPs on behavioral impairment in PD model mice. A pole test on days 3 and 5 post-MPTP injection (A, B) and a rotarod test on days 4 and 6 post-MPTP injection (C, D) were conducted (n=8). (E) Representative activity traces (green) derived from video tracking. Total distance traveled (F) and average speed (G) of treated mice (n=8). *p<0.05, **p<0.01, ***p<0.001 vs the Control group. #p<0.05, ##p<0.01, ###p<0.001 vs the GB group.

