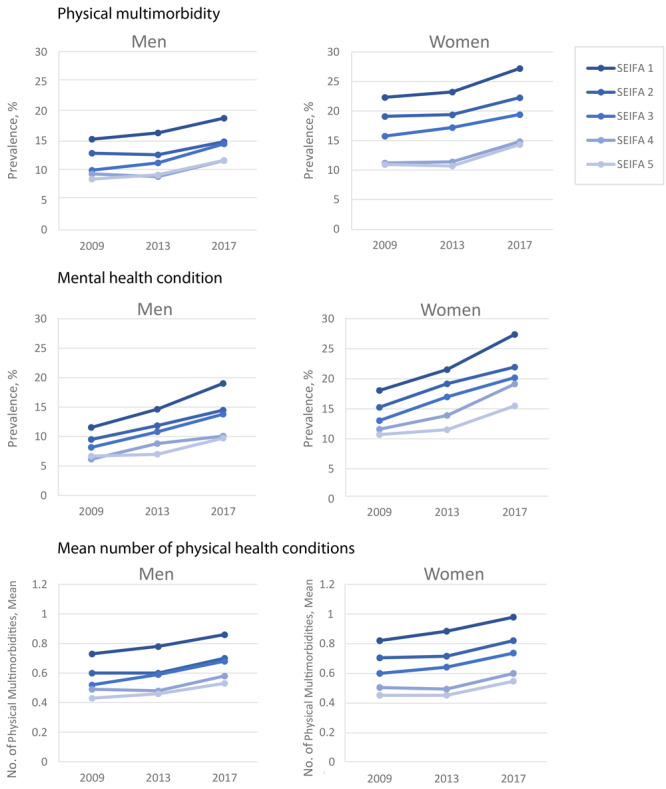
Figure 2.
Prevalence of physical multimorbidity and mental health conditions and the mean number of physical health conditions across 3 waves of the Household, Income and Labour Dynamics in Australia (HILDA) Survey, 2009, 2013, and 2017, by sex and socioeconomic status. Socioeconomic status is measured on the SEIFA (Socio Economic Indexes for Areas) scale and ranges from 1 to 5, with 5 being the highest status (18).
| HILDA Wave | SEIFA 1 | SEIFA 2 | SEIFA 3 | SEIFA 4 | SEIFA 5 |
|---|---|---|---|---|---|
| Men | |||||
| Physical multimorbidity | |||||
| 9 (2009) | 17.8 | 15.1 | 11.7 | 11.0 | 10.0 |
| 13 (2013) | 19.1 | 14.8 | 13.1 | 10.5 | 10.8 |
| 17 (2017) | 21.9 | 17.3 | 16.9 | 13.6 | 13.7 |
| Mental health conditions | |||||
| 9 (2009) | 11.54 | 9.5 | 8.16 | 6.14 | 6.68 |
| 13 (2013) | 14.6 | 11.9 | 10.8 | 8.8 | 7.0 |
| 17 (2017) | 19.0 | 14.5 | 13.8 | 10.1 | 9.7 |
| Mean number of physical health conditions | |||||
| 9 (2009) | 0.7 | 0.6 | 0.5 | 0.5 | 0.4 |
| 13 (2013) | 0.8 | 0.6 | 0.6 | 0.5 | 0.5 |
| 17 (2017) | 0.9 | 0.7 | 0.7 | 0.6 | 0.5 |
| Women | |||||
| Physical multimorbidity | |||||
| 9 (2009) | 22.3 | 19.1 | 15.8 | 11.2 | 11.0 |
| 13 (2013) | 23.2 | 19.4 | 17.2 | 11.4 | 10.7 |
| 17 (2017) | 27.2 | 22.3 | 19.4 | 14.8 | 14.3 |
| Mental health conditions | |||||
| 9 (2009) | 18.1 | 15.3 | 13.1 | 11.6 | 10.7 |
| 13 (2013) | 21.5 | 19.2 | 17.0 | 13.9 | 11.5 |
| 17 (2017) | 27.4 | 22.0 | 20.2 | 19.1 | 15.5 |
| Mean number of physical health conditions | |||||
| 9 (2009) | 0.8 | 0.7 | 0.6 | 0.5 | 0.5 |
| 13 (2013) | 0.9 | 0.7 | 0.7 | 0.5 | 0.5 |
| 17 (2017) | 1.0 | 0.8 | 0.8 | 0.6 | 0.6 |