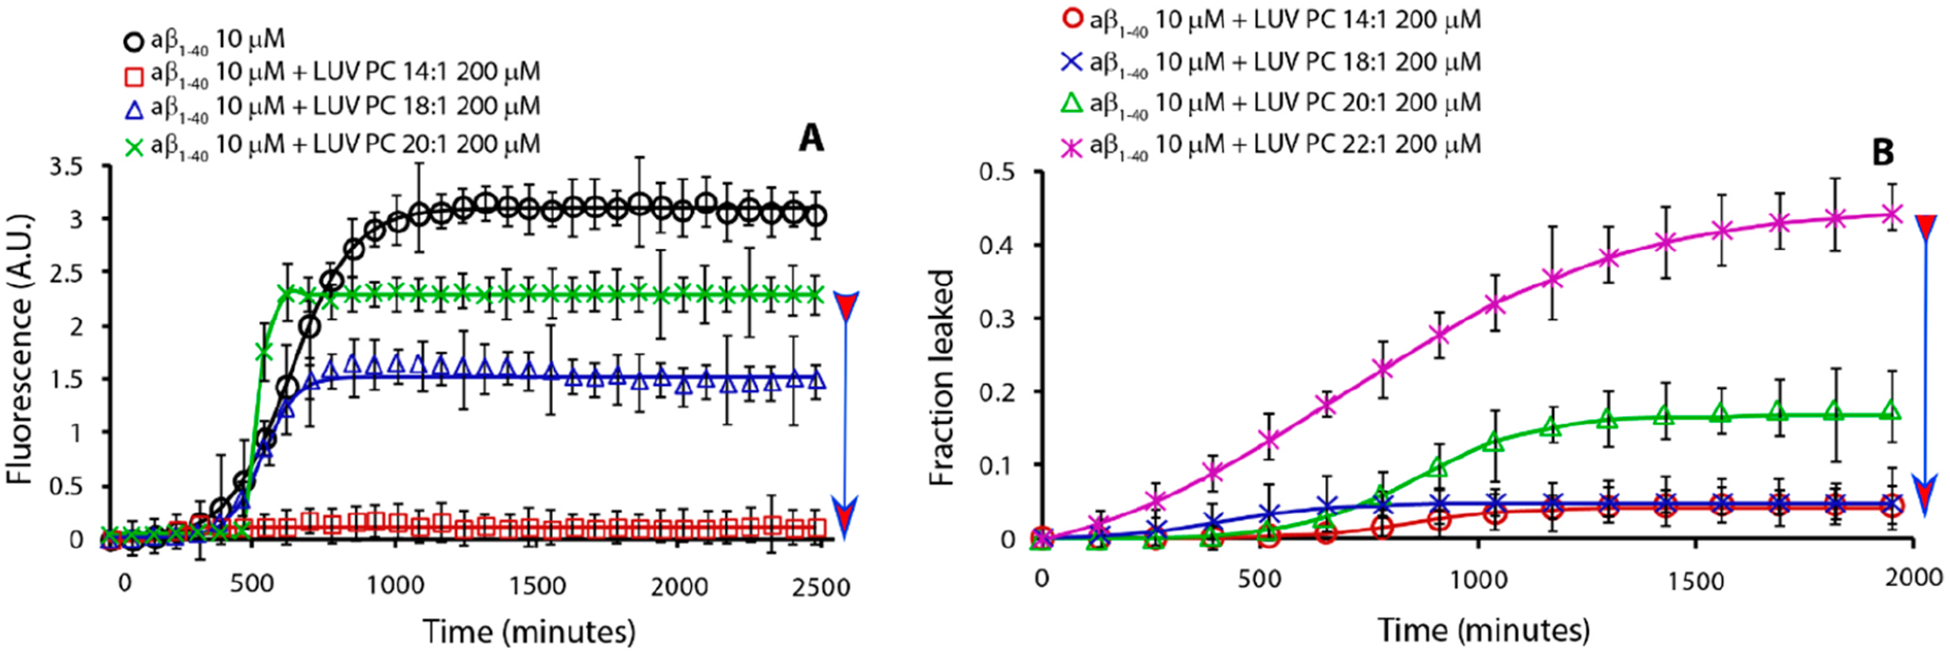
Figure 1.

Effect of lipid’s hydrocarbon chain length on Aβ1‑40 fibril formation kinetics (A) and Aβ1‑40-induced dye leakage (B). Part A is ThT traces and part B is dye-leakage for samples containing 10 μM Aβ1‑40 (black circle, no lipids) in the presence of 200 μM LUVs of PC lipids having acyl chains of 14:1 (red square), 18:1 (blue triangle), 20:1 (green star), and 22:1 (magenta cross). Experiments were performed at 37 °C in 10 mM phosphate buffer and 100 mM NaCl, pH 7.4. All results are the average of three experiments. The arrow indicates lipids from low to high CMC.
