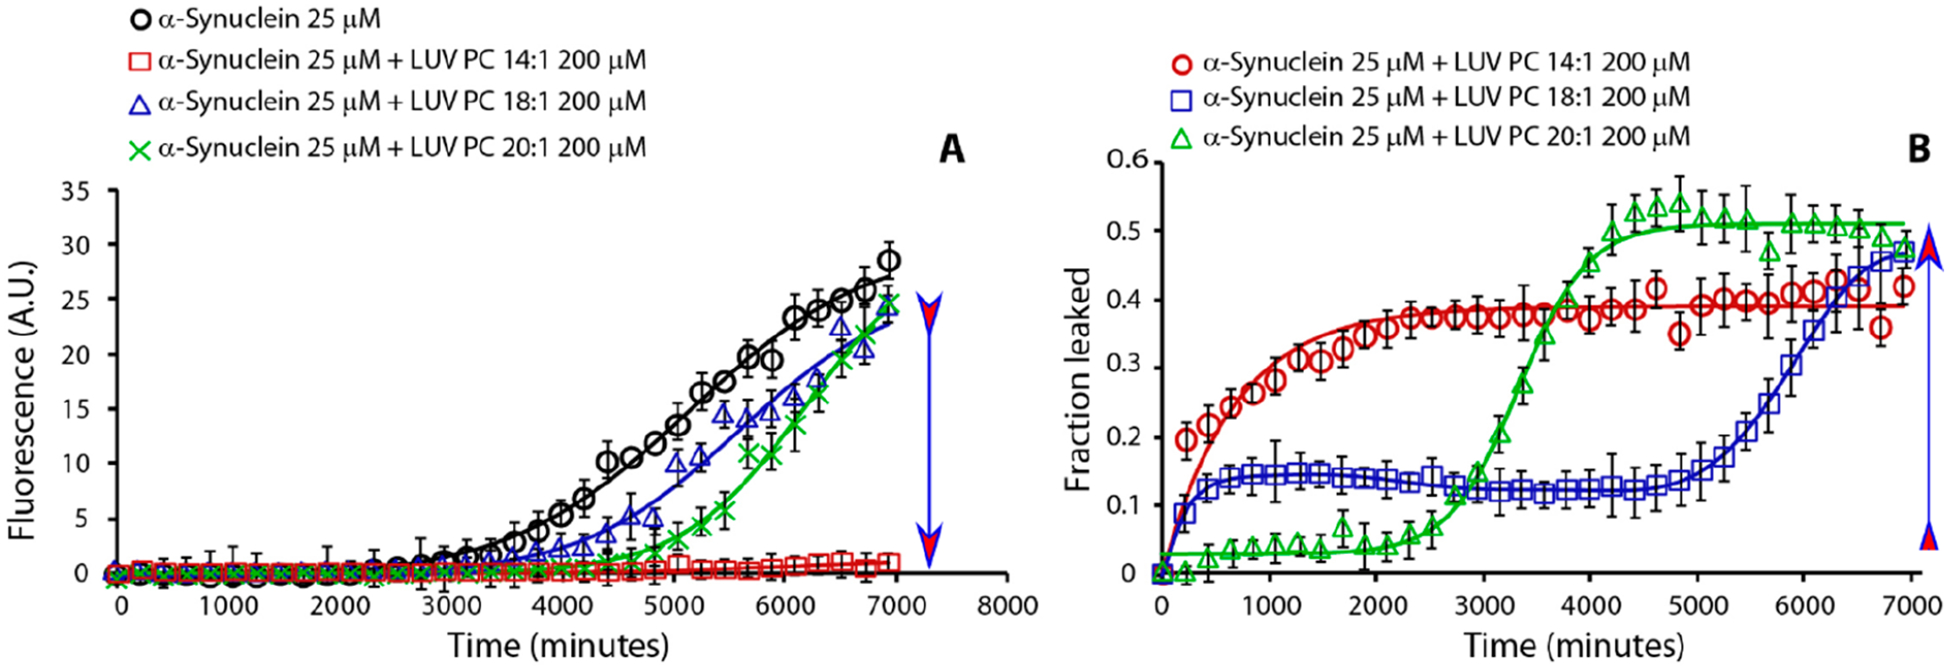
Figure 3.

Effect of lipid’s hydrocarbon acyl chain length on α-syn amyloid formation kinetics (A) and dye-leakage (B). Part A is ThT traces and part B is dye-leakage from samples containing 25 μM α-syn (black circle curve) in the presence of 200 μM LUVs of PC 14:1 (red square), 18:1 (blue triangle), and 20:1 (green cross). Experiments were performed at 37 °C in 10 mM phosphate buffer and 100 mM NaCl pH 7.4. Solid line represents the best fit. All results are the average of three experiments. The arrow indicates lipids from low to high CMC.
