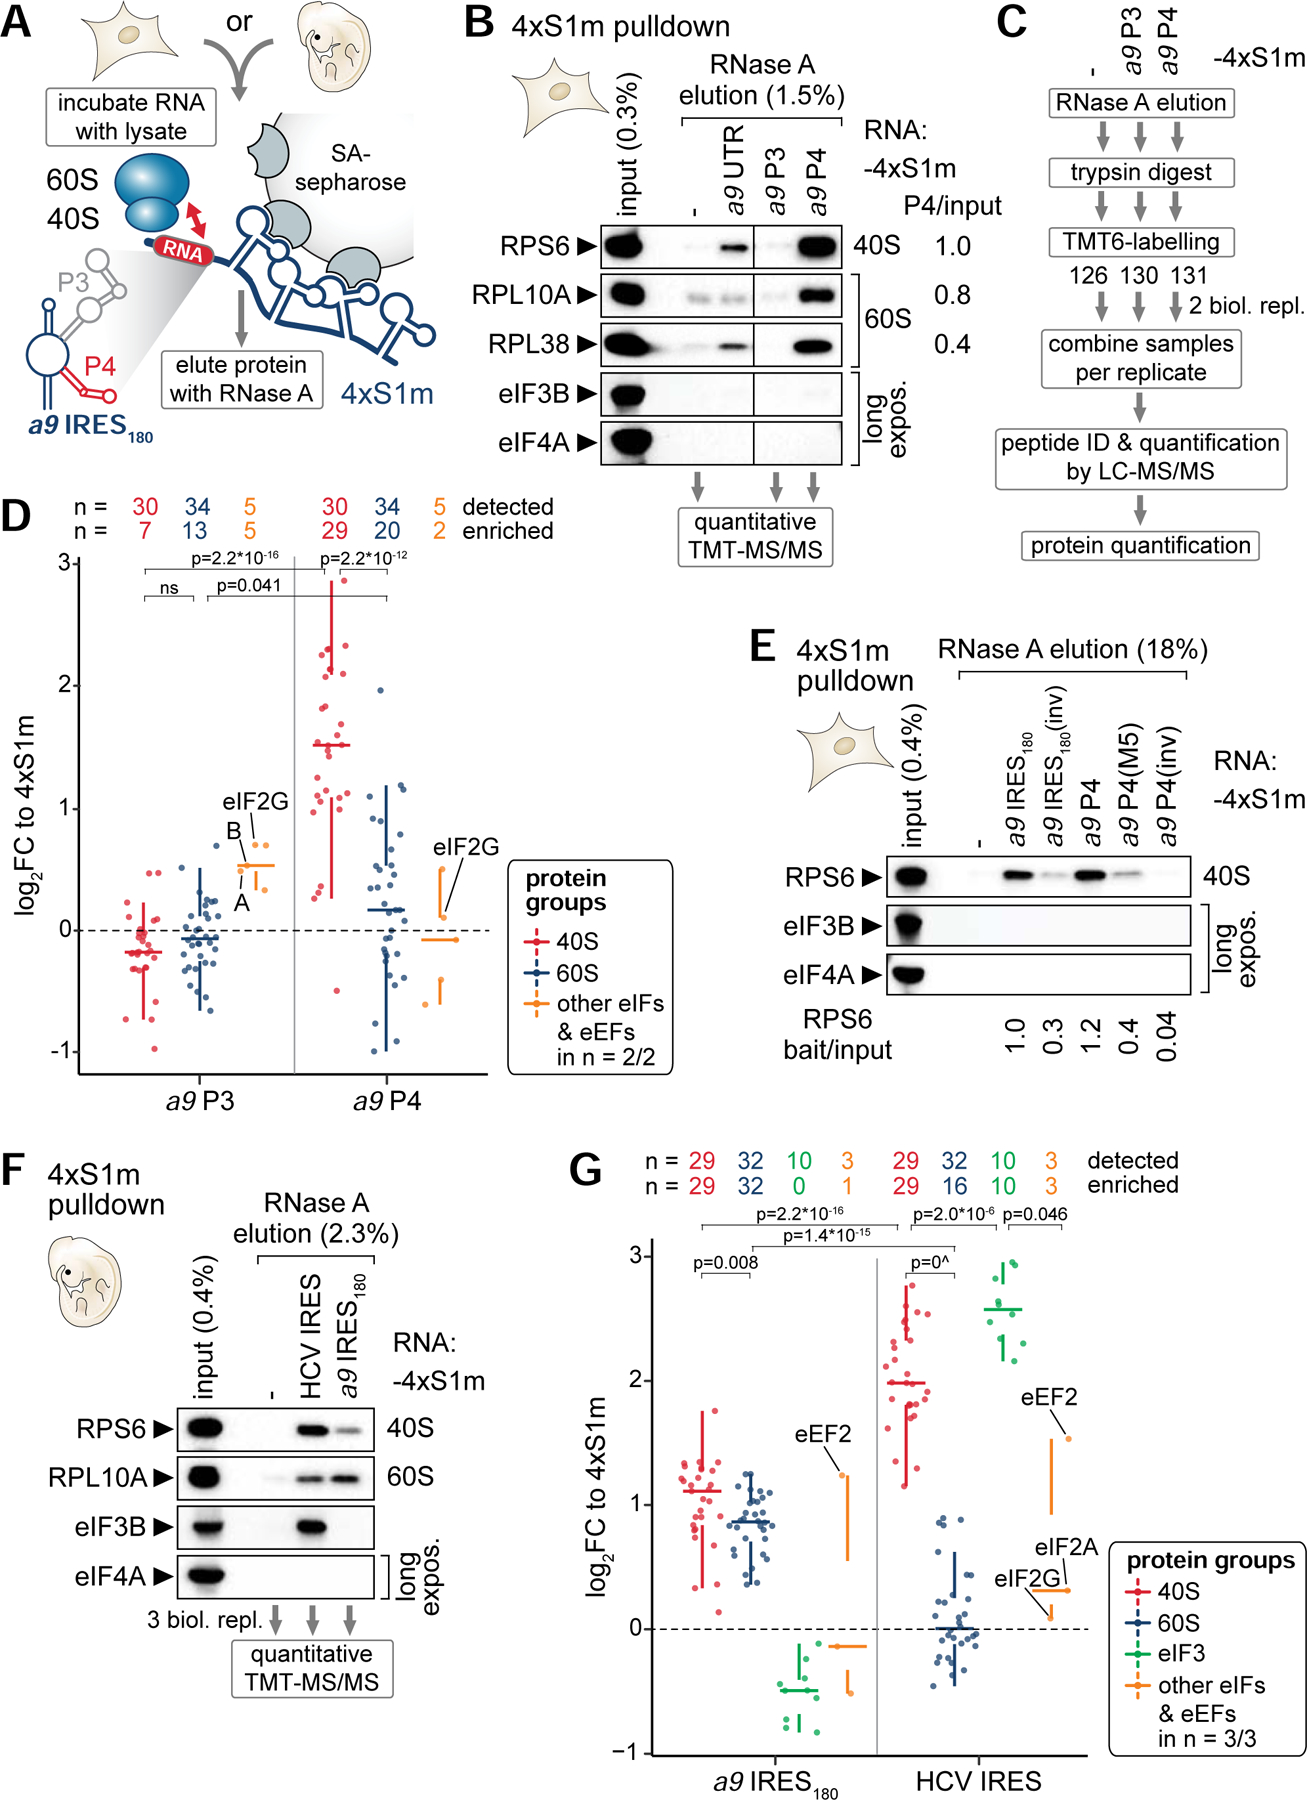
Figure 3. The Hoxa9 IRES-like element binds to the 40S ribosomal subunit via P4.

(A) Schematic of the 4xS1m pulldown to probe interactions of in vitro transcribed 4xS1m-aptamer fusion RNA with lysate components from C3H/10T1/2 cells or mouse embryos to form ribonucleoproteins (RNPs) in vitro. SA, streptavidin.
(B) 4xS1m pulldown is performed by combining mouse Hoxa9 mRNA elements with C3H/10T1/2 cell lysates. The aptamer alone (−) served as negative control. RPs of the 40S and 60S subunit and eIFs were monitored by western blot (WB) analysis. The fraction loaded of input and elution samples is expressed as percentage of the original lysate volume. Representative of n = 2 is shown. RNase A elutions of the aptamer control, P3 and P4 were subjected to mass spectrometry (MS) analysis. Differential enrichment of RPs compared to input with P4 was normalized to RPS6 set to 1. UTR, full-length Hoxa9 5’ UTR.
(C) Workflow for identifying and quantifying proteins in RNase A elutions by quantitative MS using tandem mass tag (TMT) peptide labelling. Proteins were trypsin-digested into peptides, labeled with a distinct TMT, mixed equally per replicate, and subjected to liquid chromatography (LC)-tandem MS (MS/MS) analysis for multiplex quantification.
(D) Analysis of TMT-MS/MS data displayed as log2 fold change (FC) relative to the aptamer control (4xS1m) for a9 P3 and P4 shows the relative abundance of proteins detected and enriched in respective protein groups compared to their levels in the control. Samples correspond to the pulldown in (B) from C3H/10T1/2 cells. Only proteins detected in 2/2 biological replicates are shown. See also Table S4.
(E) 4xS1m-pulldown as described in (B) comparing the a9 IRES180 and a9 P4 to control constructs. Lysates of C3H/10T1/2 cells were used as input. Representative of n = 3 is shown. Differential enrichment of RPS6 compared to input with RNA baits was normalized to a9 IRES180 set to 1.
(F) 4xS1m-pulldown as described in (B) comparing the a9 IRES180 to an unrelated viral IRES, HCV. Lysates of FVB stage E11.5 mouse embryos were used as input. Representative of n = 3 is shown. RNase A elutions were subjected to TMT-MS/MS analysis.
(G) Analysis of TMT-MS/MS data displayed as log2 fold change (FC) relative to 4xS1m for a9 IRES180 and HCV IRES as in (D). Samples correspond to the pulldown in (F) from FVB stage E11.5 mouse embryos. Only proteins detected in 3/3 biological replicates are shown. See also Table S5.
