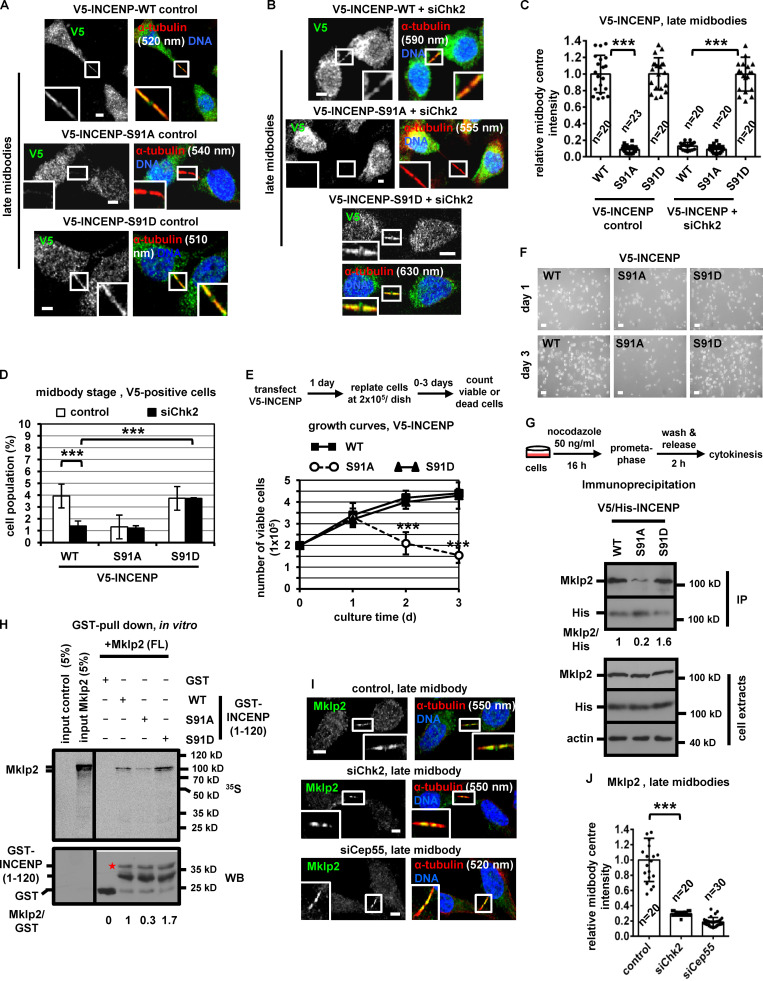
Figure 4.
Expression of INCENP-Ser91A reduces the frequency of midbody stage cells and diminishes cell proliferation. (A–C) Localization and mean intensity of V5-INCENP at the midbody center in BE cells. Scale bars, 5 µm. (D) Frequency of midbody stage BE cells. Values represent mean ± SD from three independent experiments (n > 900). (E and F) Growth curves and phase-contrast images in BE cells expressing V5-INCENP plasmids. Values represent mean ± SD from three independent experiments (n = 6). Scale bars, 50 µm. (G) Immunoprecipitation (IP) of V5/His-INCENP and Mklp2 from cytokinesis-enriched BE cell extracts. (H) GST pull-down. Radiolabeled FL Mklp2 generated by in vitro transcription-translation was incubated with GST-INCENP or GST. Phosphorimager (35S, top) and Western blot analysis (WB; bottom) of the same gel. Asterisk indicates predicted molecular weight. (I and J) Localization and mean intensity of Mklp2 at the midbody center in BE cells. Values represent mean ± SD from n cells. Values in control were set to 1. ***, P < 0.001 (ANOVA and Student’s t test). Tubulin values indicate midbody thickness. Insets show 1.6× magnification of the midbodies. S, serine. Scale bars, 5 µm.

