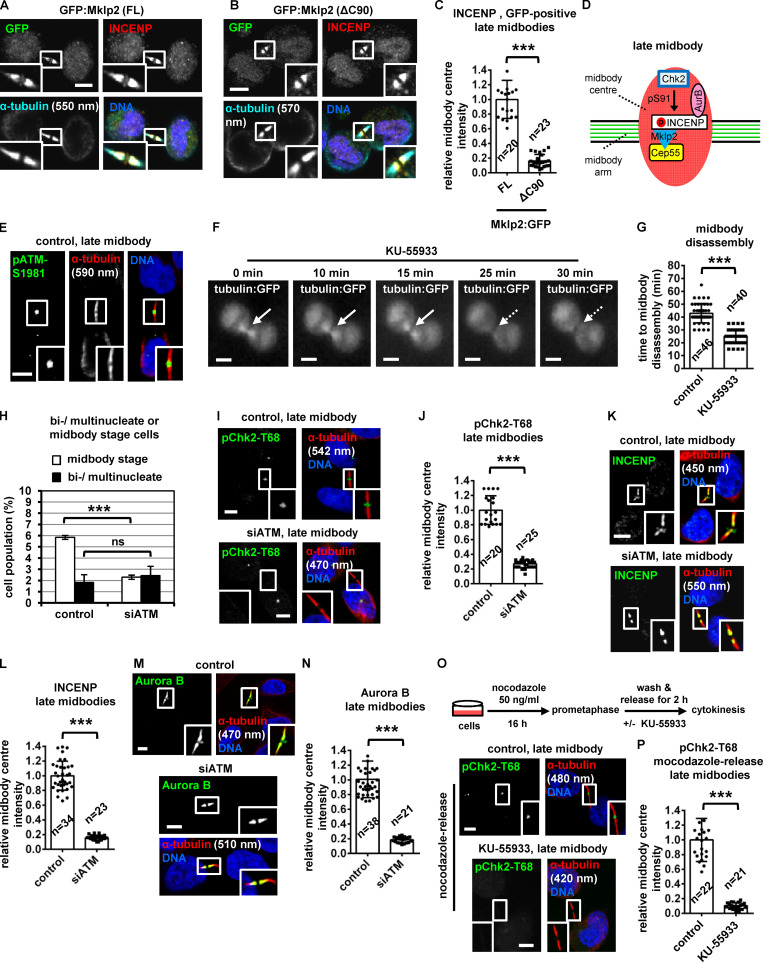
Figure 6.
ATM inhibition accelerates midbody disassembly. (A–C) Localization and mean intensity of INCENP at the midbody center in BE cells expressing FL or truncated (ΔC90) GFP:Mkp2. (D) Mechanism of INCENP-Aurora B localization to the midbody center. p, phosphorylation. (E) Phosphorylated ATM-Ser1981 (pATM-Ser1981) localizes to the midbody center in BE cells. (F and G) Time-lapse microscopy analysis of HeLa cells expressing tubulin:GFP. Cells were untreated (control) or treated with 10 µM KU-55933 immediately before filming. Midbodies are shown by solid arrows. Time from midbody formation to midbody disassembly (dotted arrows) is indicated. (H) Frequency of bi/multinucleate or midbody stage BE cells. Values represent mean ± SD from three independent experiments (n > 900). (I–N) Localization and mean intensity of phospho-Chk2-Thr68 (pChk2-Thr68), INCENP or Aurora B at the midbody center in BE cells. (O and P) Localization and mean intensity of pChk2-Thr68 after treatment of BE cells with 10 µM KU-55933 in cytokinesis. Values represent mean ± SD from n cells. Values in control were set to 1. Tubulin values indicate midbody thickness. Insets show 1.6× magnification of the midbodies. S, serine. ns, not statistically significant; ***, P < 0.001 (Student’s t test). Scale bars, 5 µm.

