Figure 9.
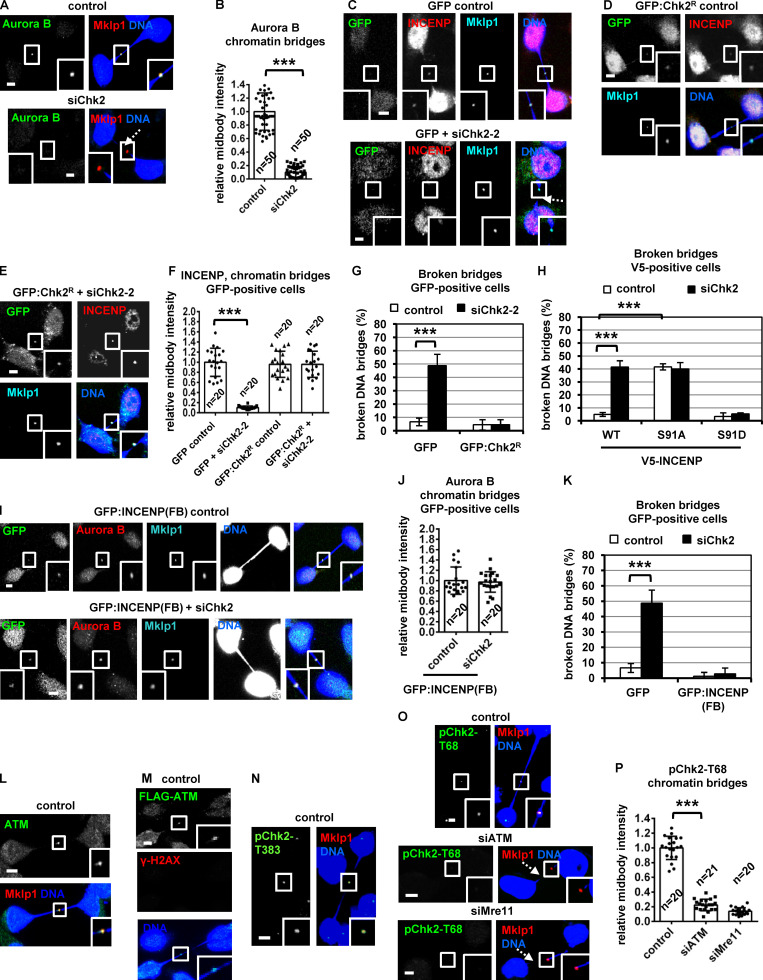
Expression of INCENP-Ser91A correlates with chromatin bridge breakage in cytokinesis. (A, B, O, and P) Localization and mean intensity of Aurora B or phospho-Chk2-Thr68 (pChk2-Thr68) at the midbody in telophase BE cells with chromatin bridges. (C–F, I, and J) Localization and mean intensity of INCENP and Aurora B at the midbody in cells expressing GFP, siRNA-resistant GFP:Chk2R, or GFP:INCENP(FB). Values represent mean ± SD from n cells. Values in control were set to 1. Broken chromatin bridges are indicated by dotted arrows. (G, H, and K) Percentage of broken DNA bridges in BE cells. Values represent mean ± SD from three independent experiments (n > 150). ***, P < 0.001 (ANOVA and Student’s t test). (L–N) Localization of ATM, FLAG-ATM, or phosphorylated Chk2-Thr383 (pChk2-Thr383) in BE cells. Insets show 1.6× magnification of the midbodies. S, serine; T, threonine. Scale bars, 5 µm.

