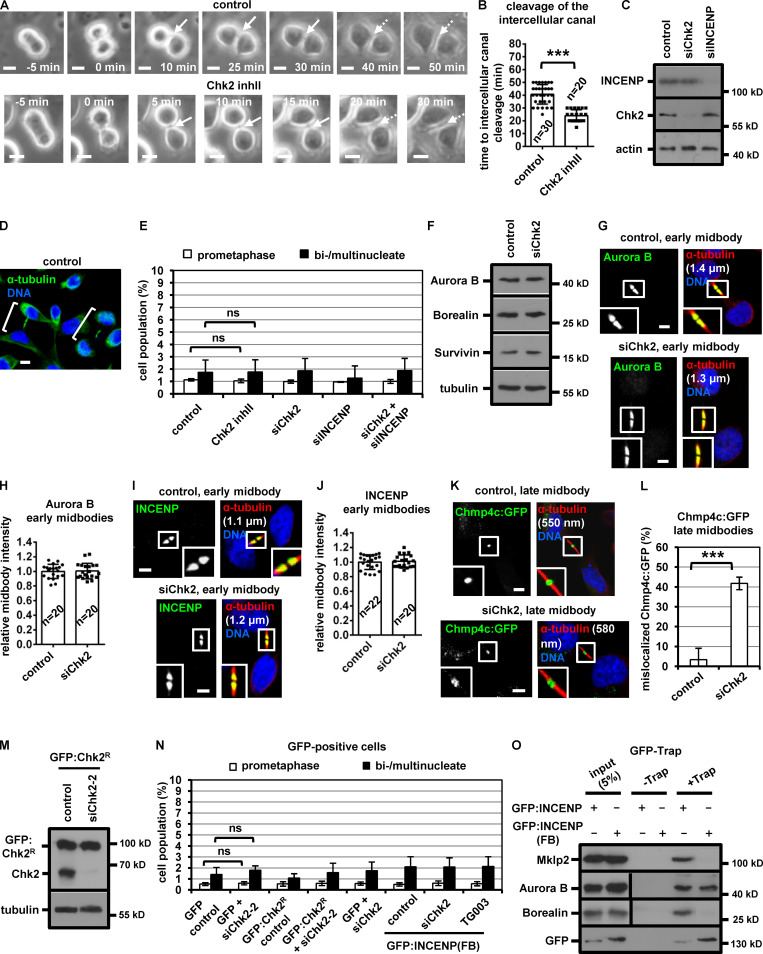
Figure S1.
Chk2-depletion correlates with mislocalization of Chmp4c:GFP in late midbodies. (A and B) Phase-contrast live-cell microscopy analysis of HeLa tubulin:GFP cells. Cells were untreated (control) or treated with 10 µM Chk2 inhibitor II (inhII) immediately before filming. Intercellular canals are shown by solid arrows. Time is from formation of an intercellular canal to canal cleavage (dotted arrows). Related to Video 3 and Video 4. (C and F) Western blot analysis of total CPC proteins, Chk2, actin and tubulin from BE cell extracts. (D) Examples of BE cells at midbody stage (shown in brackets). (E and N) Frequency of bi/multinucleate or prometaphase BE cells. Cells were transfected as indicated or treated with 10 µM Chk2 inhibitor II or TG003 for 4 h. Values represent mean ± SD from three independent experiments (n > 90). (G–J) Localization of Aurora B or INCENP and mean intensity at the midbody in BE cells in early midbodies. Values represent mean ± SD from n cells. Values in control were set to 1. (K and L) Chmp4c:GFP localization and frequency of BE cells exhibiting mislocalized Chmp4c:GFP (two dots) at late midbodies. Values represent mean ± SD from three independent experiments (n > 90). Tubulin values indicate midbody thickness. Insets show 1.6× magnification of the midbodies. (M) Western blot analysis of total Chk2 and tubulin in cells transfected with siRNA-resistant GFP:Chk2R. (O) GFP-Trap assay. BE cell lysates were incubated with GFP-Trap (+Trap) or agarose beads only (−Trap). Precipitated proteins were analyzed by Western blotting. ns, not statistically significant; ***, P < 0.001 (Student’s t test). Scale bars, 5 µm.

