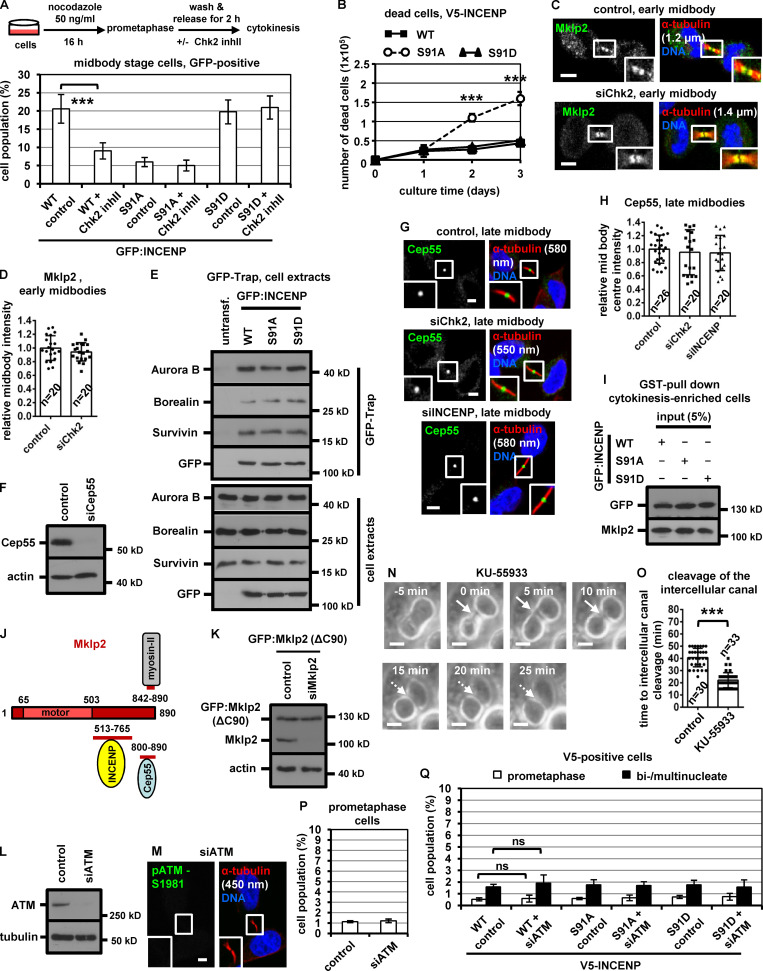
Figure S3.
Mutation of Ser91 to alanine does not impair INCENP-association with CPC proteins. (A) Frequency of midbody stage cells. BE cells were released from a prometaphase block and treated with 10 µM Chk2 inhibitor II (inhII) in cytokinesis, or left untreated. Values represent mean ± SD from three independent experiments (n > 900). (B) Accumulation of dead BE cells with time as determined by trypan blue staining. Mean ± SD from three independent experiments (n = 6). (A and B) ***, P < 0.001 (ANOVA and Student’s t test). (C, D, G, and H) Localization of Mklp2 or Cep55 and mean intensity at the midbody or midbody center in BE cells. (E) GFP-Trap assay. BE cells were untransfected (untransf.) or transfected with GFP:INCENP. Precipitated (top) or total proteins (bottom) were analyzed by Western blotting. (F and L) Western blot analysis of total Cep55, ATM, actin and tubulin. (I) Total GFP and Mklp2 from Fig. 5 I. (J) Cartoon indicating the regions of human Mklp2 protein interacting with INCENP, Cep55 and myosin-II. Numbers show amino-acid residues. motor, kinesin motor domain. (K) Western blot analysis of total Mklp2 and actin in BE cells expressing GFP:Mklp2(ΔC90). (M) Specificity of the anti-phospho-ATM-Ser1981 (pATM-Ser1981) antibody. Tubulin values indicate midbody thickness. Insets show 1.6× magnification of the midbodies. (N and O) Phase-contrast live-cell microscopy analysis of HeLa tubulin:GFP cells treated with 10 µM KU-55933 in cytokinesis. Intercellular canals are shown by solid arrows. Time is from formation of an intercellular canal to canal cleavage (dotted arrows). Related to Video 5. Values represent mean ± SD from n cells. ***, P < 0.001 (Student’s t test). Scale bars, 5 µm. (P and Q) Frequency of prometaphase or bi/multinucleate BE cells. Values represent mean ± SD from three independent experiments (n > 900). ns, not statistically significant. S, serine.

