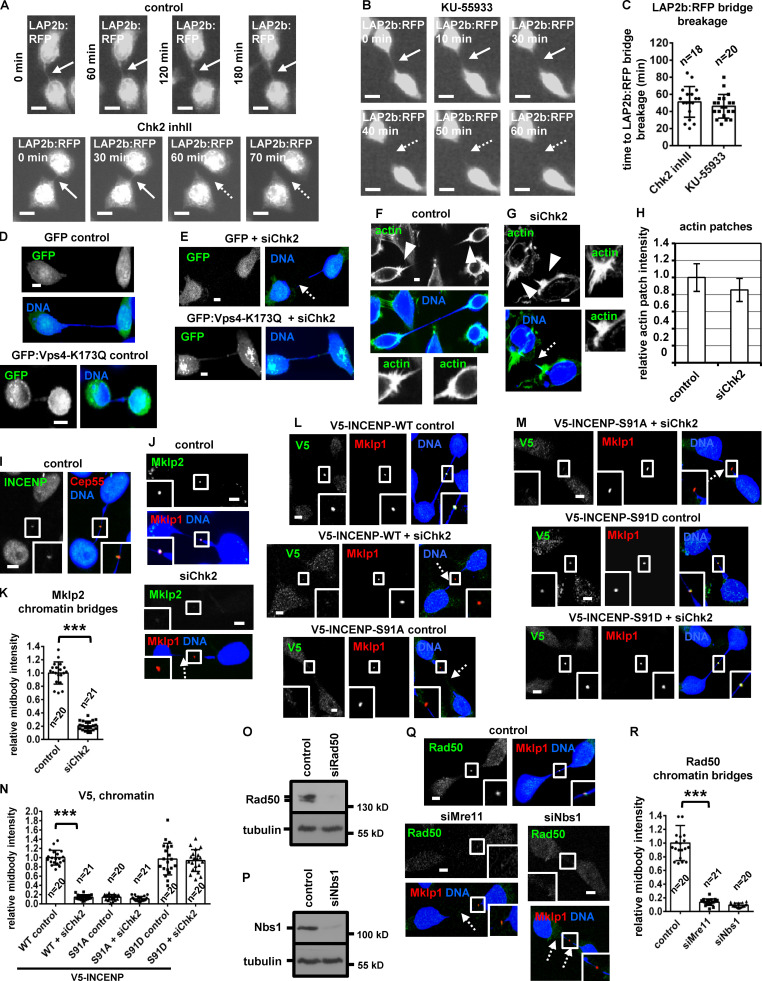
Figure S4.
Chk2 depletion correlates with breakage of LAP2b:RFP bridges in cytokinesis. (A–C) Fluorescence live-cell imaging of HeLa cells expressing LAP2b:RFP. Cells were untreated (control) or treated with 10 µM Chk2 inhibitor II (inhII) or 10 µM KU-55933 immediately before filming. Time is from the detection of the LAP2b:RFP bridges. Intact LAP2b:RFP bridges are indicated by solid arrows, and broken LAP2b:RFP bridges are indicated by dotted arrows. Related to Video 8 and Video 10. Mean ± SD from n cells. (D and E) BE cells transfected with GFP or GFP:Vps4-K173Q. (F and G) Actin patches (arrowheads) in BE cells in cytokinesis with chromatin bridges. Insets show magnification of the canals bases. (H) Relative actin-patch intensity values. Values represent mean ± SD from three independent experiments (n > 90). (I) Localization of INCENP. (J–N, Q, and R) Localization of Mklp2, V5-INCENP, or Rad50 and mean intensity at the midbody in BE cells, in cytokinesis with chromatin bridges. Insets show 1.6× magnification of the midbodies. Broken chromatin bridges are indicated by dotted arrows. Values represent mean ± SD from n cells. ***, P < 0.001 (ANOVA and Student’s t test). Scale bars, 5 µm. (O and P) Western blot analysis of total Rad50, Nbs1, and tubulin. S, serine.

