
Fig 4. Conditional Manhattan plots of the conditional −log10 (FDR) values for SNP association with LOAD conditional with SNP association with PTSD.


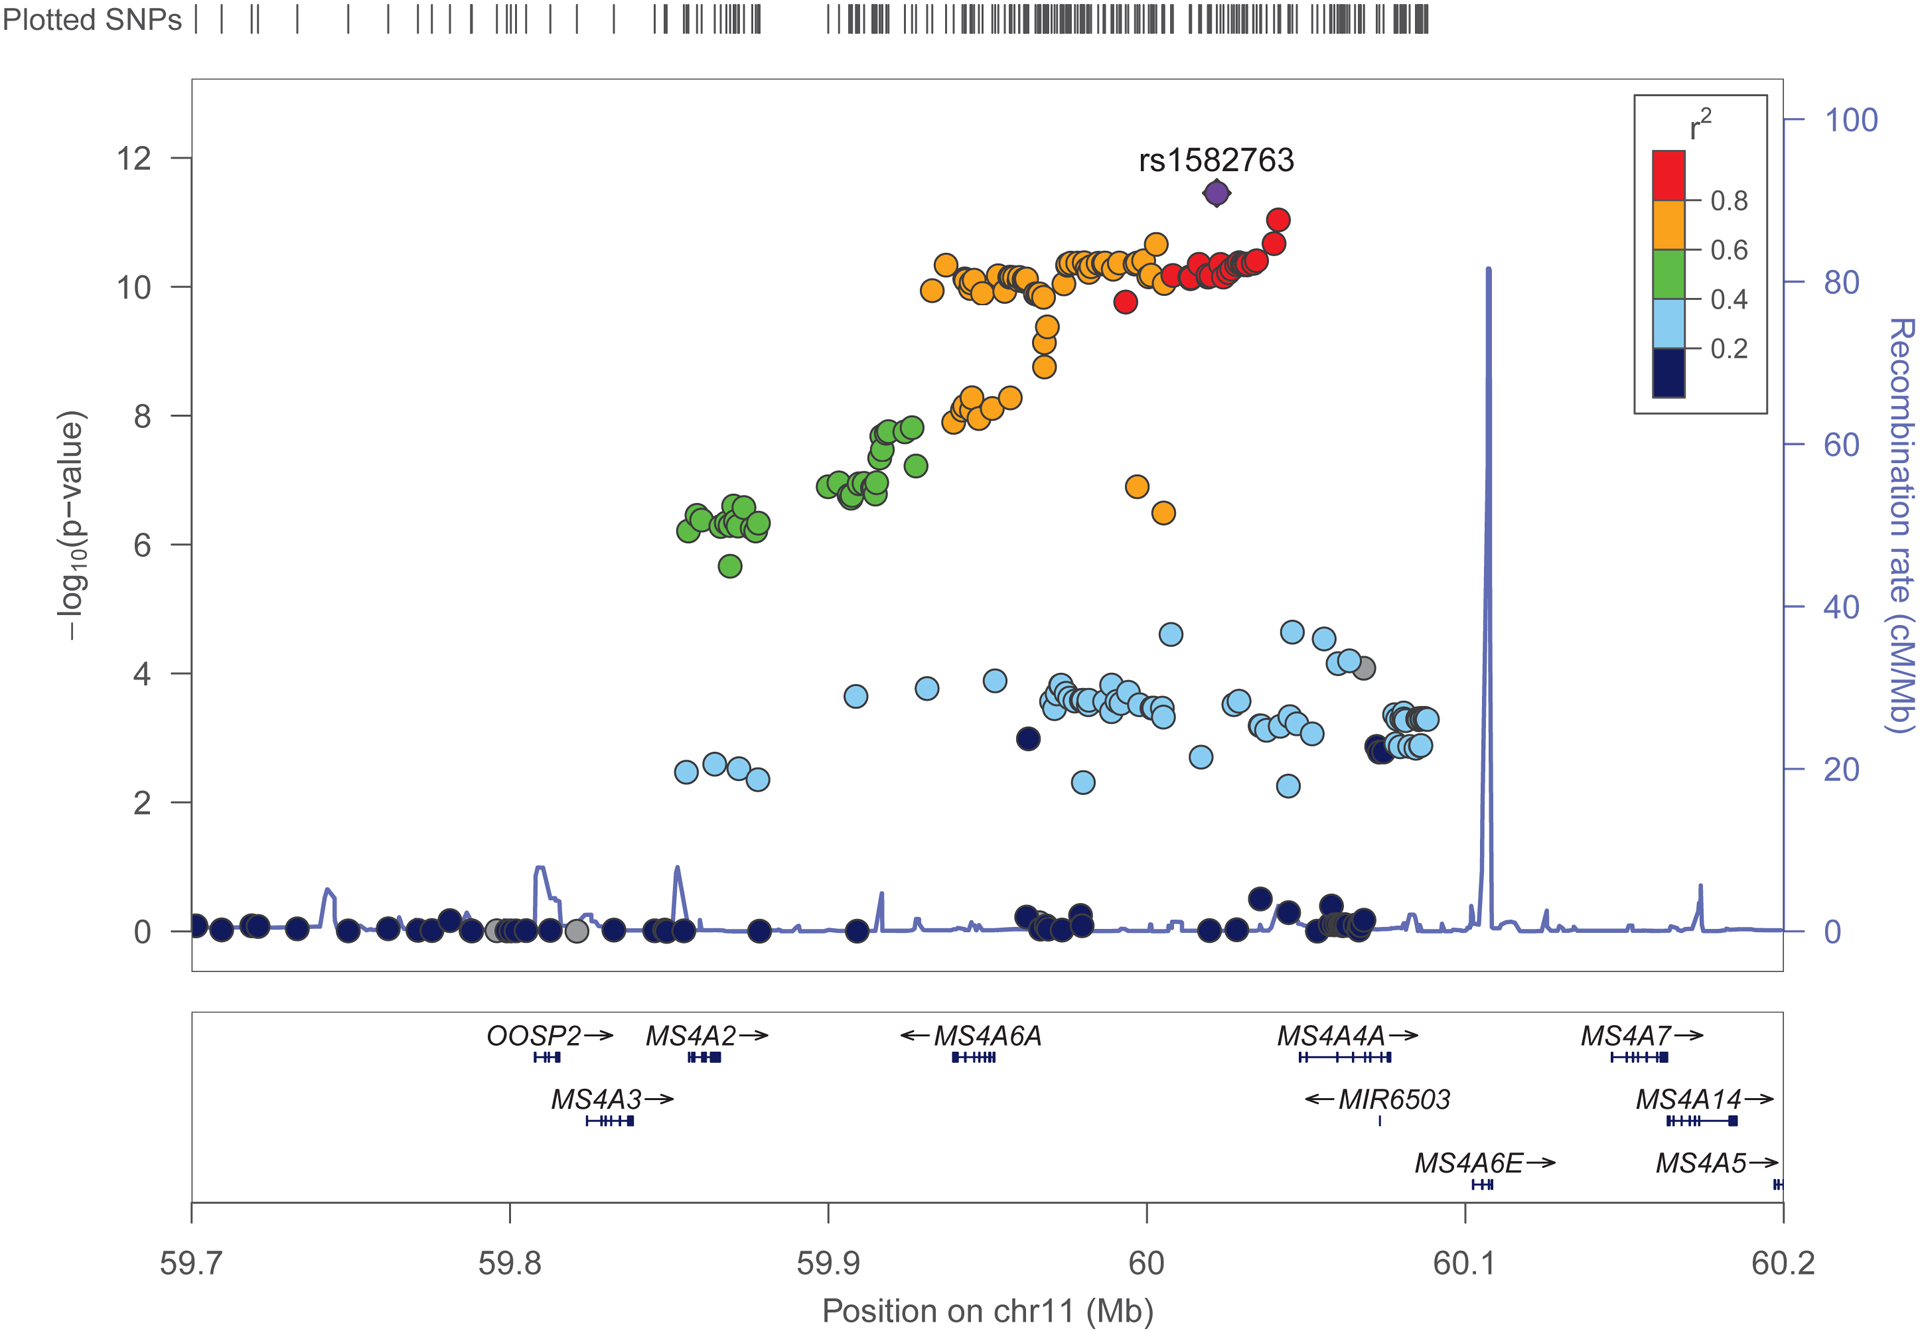
Conditional Manhattan plots show the FDR q value for SNP association with LOAD association conditional with SNP association for PTSD. Fig. 4A: Discovery sample. Fig. 4B. Replication sample. Genome-wide significant line (red) is drawn at −log10(1×10⁻⁵), suggestive line (blue) is drawn at −log10(0.05). Fig. 4C. Locus zoom plot of the region on chromosome 11 contains MS4A2 that was identified as associated with Q(LOAD|PTSD) for both the discovery and replication samples