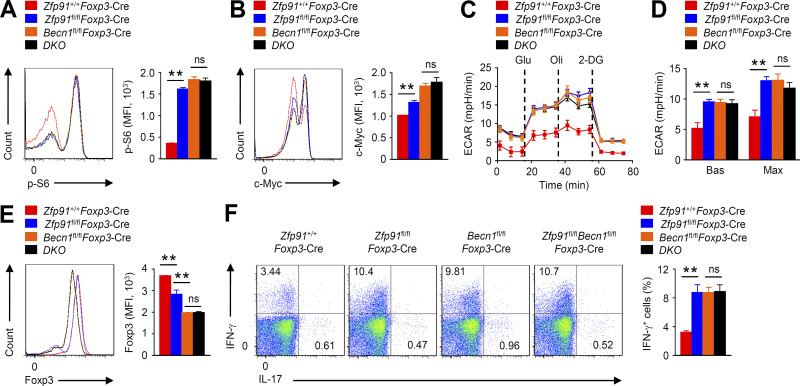
Figure 8.
ZFP91 promotes autophagy-mediated T reg cell metabolism and homeostasis. (A and B) Flow cytometric analysis of p-S6 (A; n = 3 mice for each group) and c-Myc (B; n = 4 mice for each group) expression in Zfp91+/+Foxp3-Cre, Becn1fl/flFoxp3-Cre, Zfp91fl/flFoxp3-Cre, and Zfp91fl/flBecn1fl/flFoxp3-Cre (DKO) T reg cells stimulated for 4 h with antibodies against CD3 and CD28. (C and D) ECAR of Zfp91+/+Foxp3-Cre, Becn1fl/flFoxp3-Cre, Zfp91fl/flFoxp3-Cre, and Zfp91fl/flBecn1fl/flFoxp3-Cre (DKO) T reg cells stimulated for 3 h with antibodies against CD3 and CD28. (E and F) Flow cytometry analyzing Foxp3 expression (E) or cytokine expression (F) in Zfp91+/+Foxp3-Cre, Becn1fl/flFoxp3-Cre, Zfp91fl/flFoxp3-Cre, and Zfp91fl/flBecn1fl/flFoxp3-Cre (DKO) T reg cells activated in vitro with anti-CD3, anti-CD28, and IL-2 for 24 h (n = 4 mice for each group). Data are representative of three independent experiments and are presented as mean ± SEM. ns, not statistically significant; **, P < 0.01. Two-tailed Student’s t test. 2-DG, 2-deoxy-D-glucose; MFI, mean fluorescence intensity. mph, milli-pH units.

