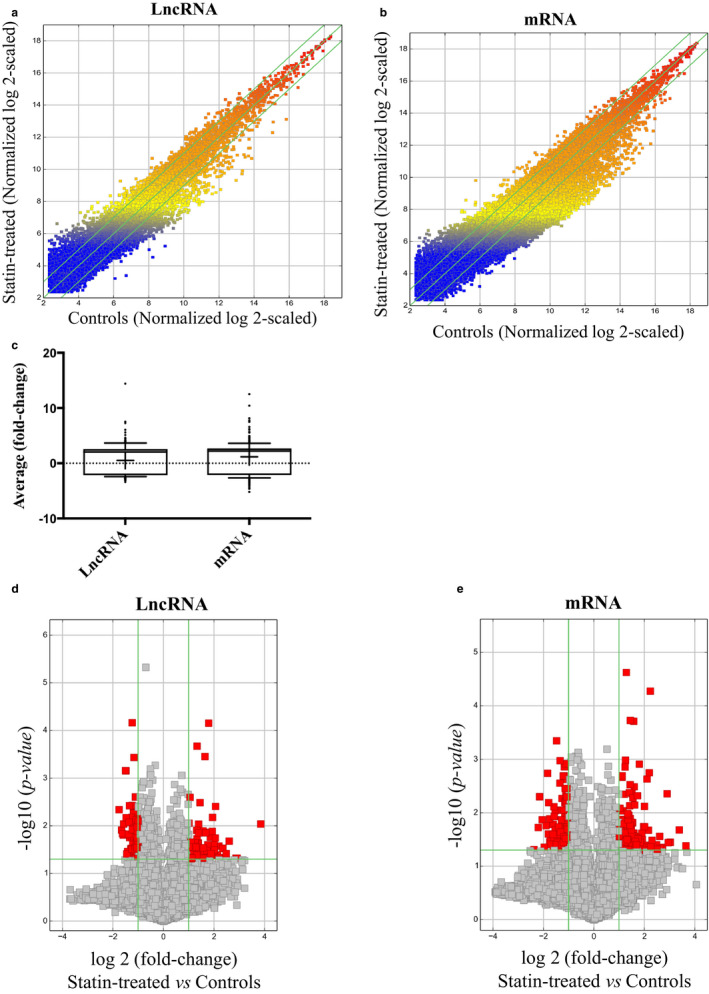
Figure 1.

LncRNA and mRNA expression profiles in HUVECs treated with pravastatin (10 µM) versus control. (a and b) Scatter plots comparing the variation in lncRNA and mRNA expression. The values plotted are the averaged normalized signal values (log2‐scaled) for the control (x‐axis) and the pravastatin‐treatment (y‐axis) groups. The green lines indicate fold‐change. LncRNAs and mRNAs above the top green line and below the bottom green line exhibit at least a 2.0‐fold difference between the two study groups. (c) Box‐and‐Whisker plots (10th, 90th percentile) showing average fold‐change of lncRNAs and mRNAs. Median intensity is denoted with a “‐” and mean intensity denoted with a “+” sign. (d & e) Volcano plots detailing the magnitude of expression difference. The vertical green lines correspond to 2.0‐fold upregulation and 2.0‐fold downregulation of expression. The horizontal green line indicates an adjusted p‐value of ≤ 0.05. Red points represent lncRNAs and mRNAs with statistically significant differential expression (fold‐change ≥ 2.0, adjusted p ≤ .05)
