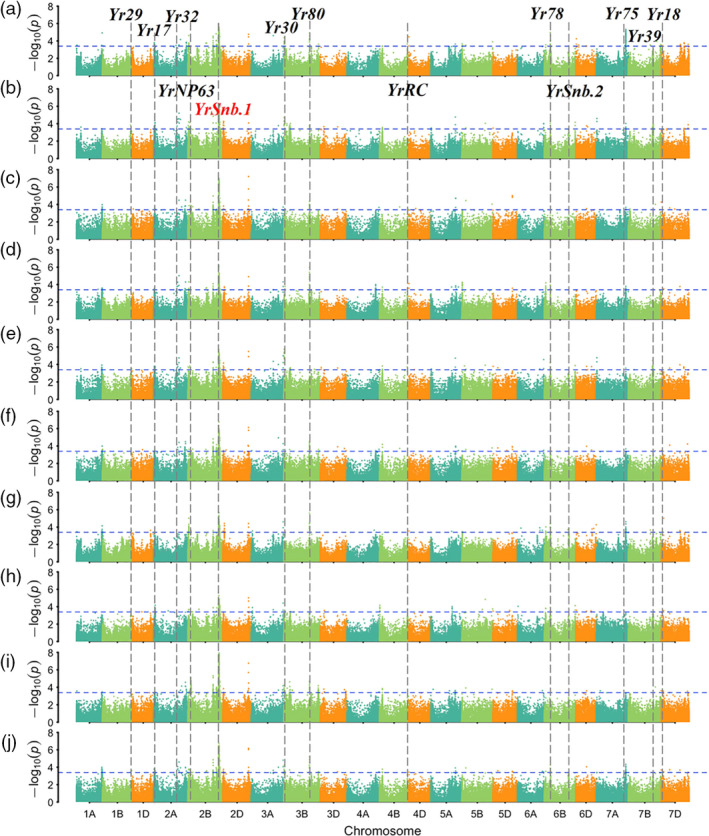
Figure 2.

Genome‐wide association analysis results for the severity of stripe rust across ten tested environments. Assessed environments included (a) 2017‐Jiangyou, (b) 2017‐Tianshui, (c) 2017‐Yanlging, (d) 2018‐Jiangyou, (e) 2018‐Tianshui, (f) 2018‐Yanlging, (g) 2019‐Jiangyou, (h) 2019‐Tianshui, (i) 2019‐Yanlging and (j) BLUP (the best linear unbiased predictions). The horizontal line shows the genome‐wide significance threshold –log10 (P) value of 3.4. The A, B and D genomes are in blue‐green, pale green and orange, respectively. The QTL detected in this GWAS panel associated with the known Yr loci are listed in the corresponding chromosome.
