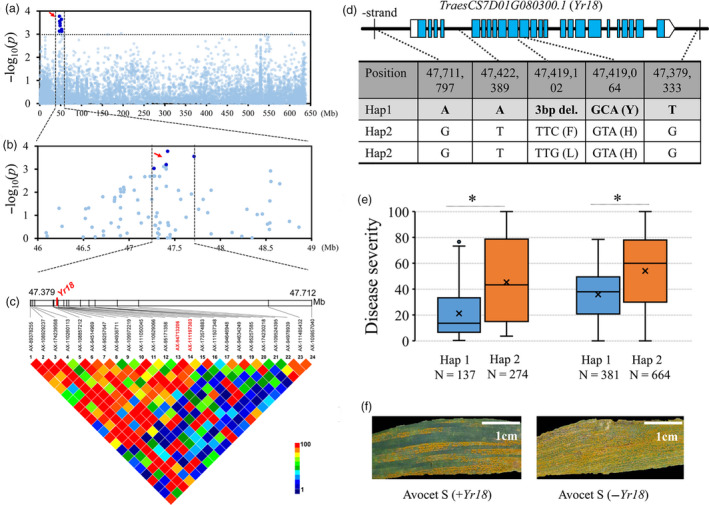
Figure 3.

Identification of the causal gene for stripe rust resistance associated with the peak on chromosome 7D. (a) Manhattan plot of single polymorphism‐based association analysis. Dashed line represents a significance threshold (−log10 P = 3.04). Significantly associated single nucleotide polymorphisms (SNPs) are shown as dark blue points, and other SNPs are shown as light blue points. (b, c) Local Manhattan plot of single‐polymorphism‐based association (top) and LD heatmap (bottom) surrounding the peak on chromosome 7D. Arrow indicates the position of nucleotide variations in TraesCS7D01G080300 (Yr18). Dashed lines indicate the candidate region for the peak. (d) The exon‐intron structure of Yr18 and its DNA polymorphisms. del, deletion. (e) Disease severities were based on the haplotypes for Yr18 in different panels of the population. Differences between the haplotypes were statistically analysed using Student's t‐test (*P < 0.05). (f) Stripe rust responses of near‐isogenic lines (±Yr18) in the common wheat cultivar Avocet S background. Scale bar, 1 cm.
