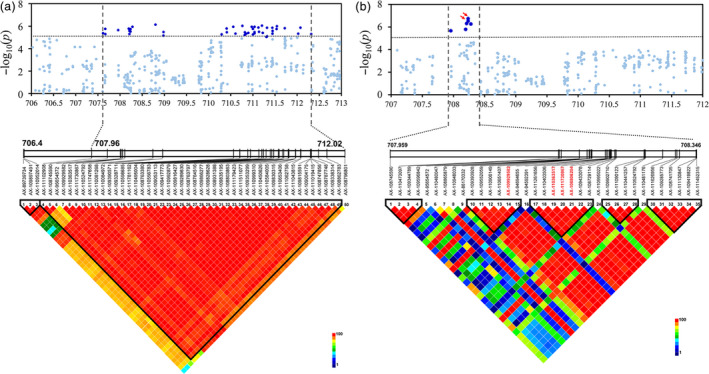
Figure 4.

Candidate region associated with stripe rust resistance on chromosome 2B detected in different GWAS panels. Manhattan plots showing the significant SNP associations for the QTL underlying stripe rust resistance detected within (a) an extensive genomic region (707.418–712.236 Mb) using a panel of 411 spring wheat lines and (b) a refined region (707.668 to 708.346) using an independent validation population of 1045 wheat accessions. Grey horizontal dashed line represents a significance threshold (−log10 P = 4.85). Significantly associated SNPs in the two data sets are shown as dark blue points, and other SNPs are shown as light blue points. The upper‐triangular halves of the linkage disequilibrium (LD, as r 2) matrices between SNPs within the candidate region are shown as heat maps below the Manhattan plots. SNP names with red text in LD plots indicate the physical positions of SNPs with significant associations.
