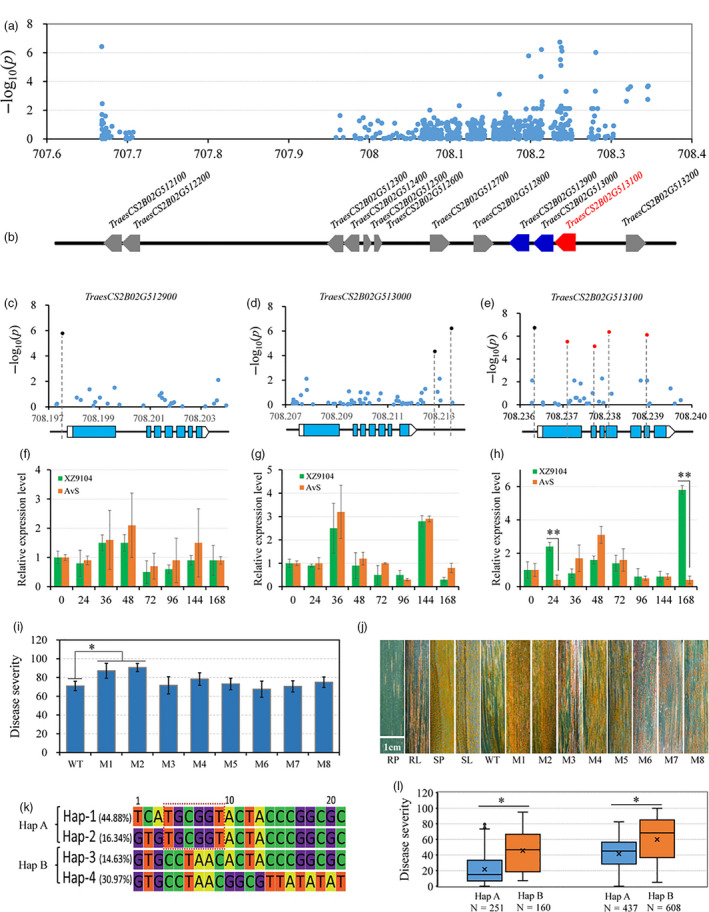
Figure 5.

Identification of the causal gene for stripe rust resistance associated with the peak on chromosome 2B. (a) Manhattan plots of polymorphic DNA variants‐based association analysis in the candidate region using resequencing data. (b) The HC genes in the candidate region. (c, d, e) Exon‐intron structures of TraesCS2B01G512900, TraesCS2B01G513000 and TraesCS2B01G513100 and their corresponding DNA polymorphisms with significant associations. (f, g, h) The relative expression levels of TraesCS2B01G512900, TraesCS2B01G513000 and TraesCS2B01G513100 in two cultivars (AvS and XZ9104) with extremely opposite YR phenotypes using qRT‐PCR. Each bar represents the mean ± SD of three biological replicates. (i) Disease severity data based on the functional variants in TraesCS2B01G512900 (M8), TraesCS2B01G513000 (M7) and TraesCS2B01G513100 (M1‐M6) in the EMS mutants. (j) Stripe rust responses for different HIFs and their parents, Snb "S" (resistant parent, RP) and ZM9023 (susceptible parent, SP), and for the durum wheat cultivar Kronos (wild type, WT) and its mutant lines. Scale bar, 1 cm. (k) Haplotype genotype and frequencies in the candidate region and the core of the favourable allele combination are in the red box. (l) Disease severities were based on the haplotypes for YrSnb.1 in different panels of the population. The asterisks indicate significant differences among groups or lines at the P < 0.05 level (Student's t‐test).
