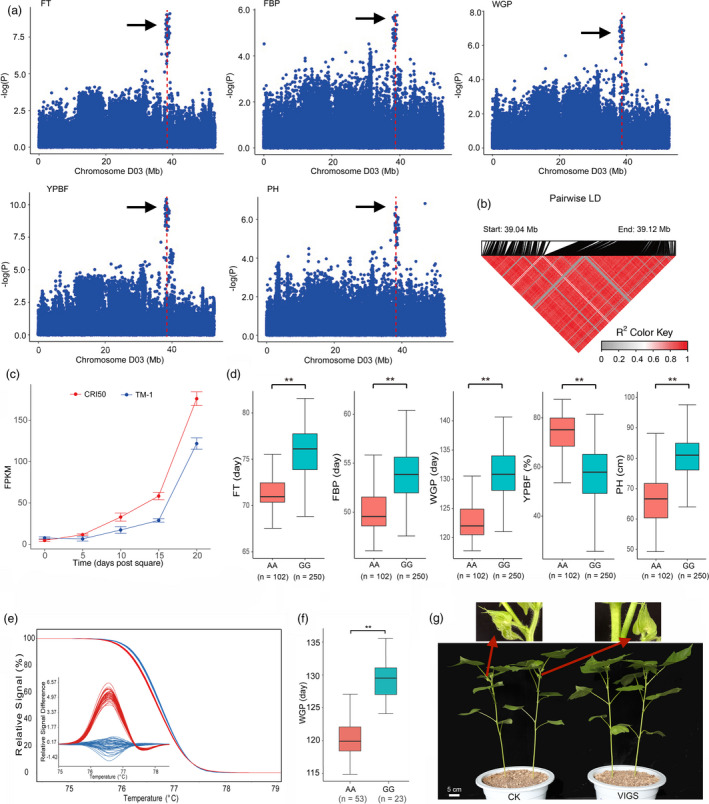
Figure 3.

GWAS for early maturity‐related traits and identification of the candidate gene on chromosome D03. (a) Manhattan plots for flowering time (FT), period from the first flower blooming to the first boll opening (FBP), whole growth period (WGP), yield percentage before frost (YPBF) and plant height (PH) on chromosome D03; Arrowheads indicate the strongly loci rsD03_39122594 associated with the candidate gene Ghir_D03G011310. (b) LD heat map for the 82.17 kb long candidate region. The pairwise LD between the SNP markers is indicated as D′ values, where red indicates a value of 1 and grey indicates 0. (c) Expression profiles of Ghir_D03G011310. The x‐axis represents developmental stages (0, 5, 10, 15 and 20 DPS), and the y‐axis indicates the relative expression levels as determined by RNA‐seq. The error bars indicate standard deviation of three biological replicates. (d) Box plots for FT, FBP, WGP, YPBF and PH between two haplotypes mentioned above (** P < 0.01). (e) HRM analysis for SNP (rsD03_39122594) in recombinant inbred line population. The axis of the outside is original melting curves; the axis of the inside is melting curves after logarithm. Red and blue curves correspond to favourable alleles (A) and unfavourable alleles (G), respectively. (f) Box plots for two haplotypes in whole growth period at recombinant inbred line population mentioned above (** P < 0.01). (g) VIGS of Ghir_D03G011310 in early maturity cotton ‘CRI50’. ‘CRI50’ treated with an empty vector were used as a control group. Red arrows indicate the squares and fruit branches.
