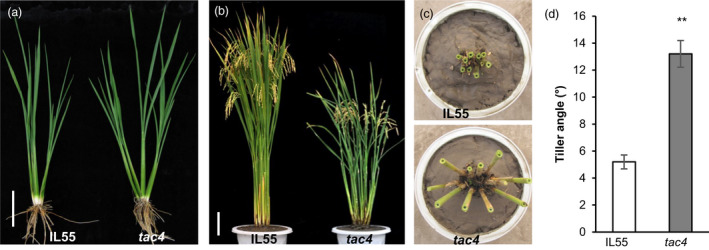
Figure 1.

Phenotypic characterization of the tac4 mutant. (a, b) Comparison of the phenotype between IL55 (left) and tac4 (right) at the tillering (a) and ripening (b) stages. Scale bar, 10 cm (a). Scale bar, 20 cm (b). (c) Comparison of the tiller angle between IL55 (above) and tac4 (below). (d) Tiller angle at the ripening stage. Error bars indicate SEM, n = 15. Student’s t‐tests were used to generate P values (** P < 0.01).
