
Figure 2.
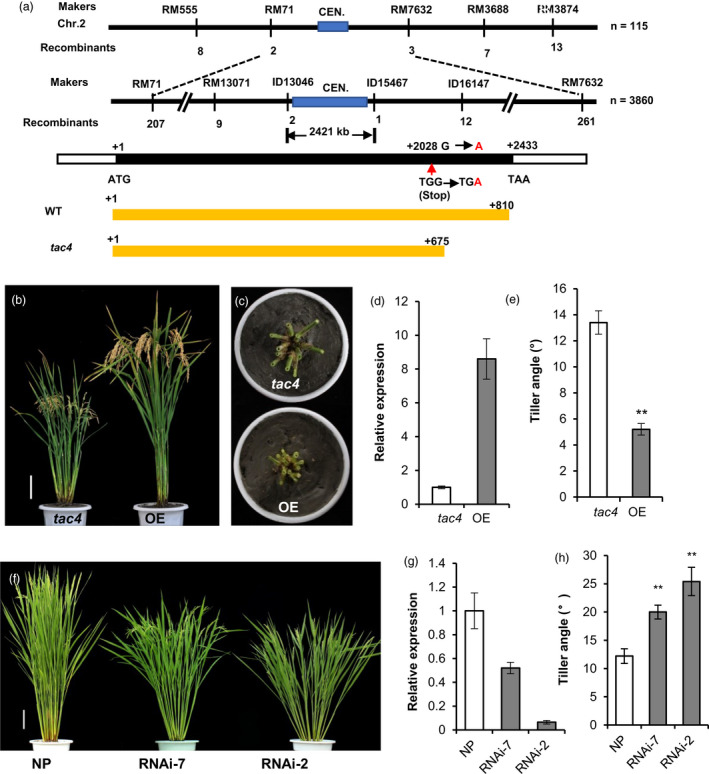
Cloning and functional confirmation of TAC4. (a) Fine mapping and a schematic representation of TAC4. Black boxes indicate the coding sequences, and white boxes indicate the untranslated regions. (b–e) The phenotypes of the TAC4‐overexpression transgenic plants. Plant architecture (b), tiller angle (c), the relative expression levels of TAC4 (d) and data on the tiller angle (e). (f–h) The phenotypes of the TAC4 RNAi transgenic plants. Tiller angle (f), the relative expression levels of TAC4 (g) and data on the tiller angle (h). Error bars indicate SEM, n = 15. Student’s t‐tests were used to generate P values (** P < 0.01).