
Figure 4.
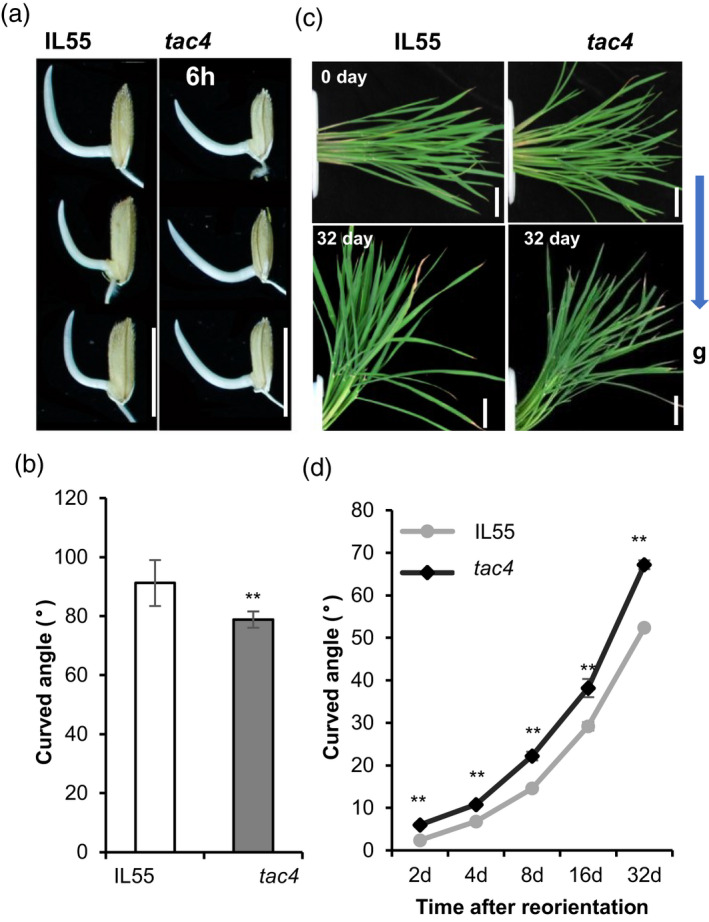
Gravitropic analysis of IL55 and tac4. (a and b) Coleoptiles of IL55 and tac4 plants after 6 h of gravistimulation. Scale bars, 1 cm. (c and d) Stem curvature of IL55 and tac4 plants at the tillering stage after 32‐ day of gravistimulation. Scale bars, 10 cm (c). Kinetic analysis of stem curvature upon gravistimulation (d). Error bars indicate SEM, n = 10. Student’s t‐tests were used to generate P values (** P < 0.01).