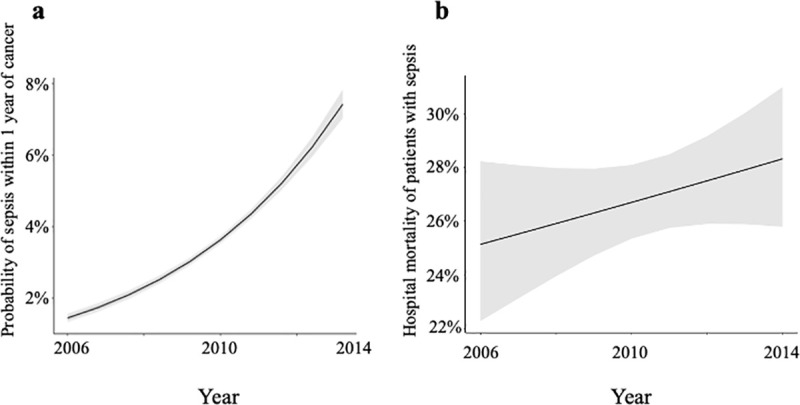
Fig 1.

Time course over the study period (2006–2014) of unadjusted probability of sepsis within 1 year for patients with a new cancer diagnosis (Fig 1(A)) and unadjusted hospital mortality for the subset of patients admitted with sepsis (Fig 1(B)). Black lines represent the unadjusted probabilities and grey areas represent the 95% confidence intervals.
